| TriState Capital Holdings Earnings History | |||||||||||||||||||||||||||||||||||||||||||||||||||||||||||||||||||||||||||||||||||||||||||||||||||||||||||||||

|
|
|
| TriState Capital Holdings Earnings History | |||||||||||||||||||||||||||||||||||||||||||||||||||||||||||||||||||||||||||||||||||||||||||||||||||||||||||||||
|
|
|
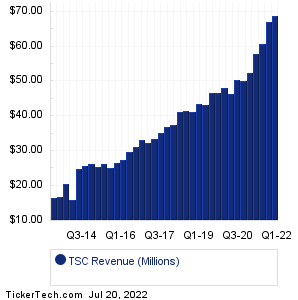
| TSC Revenue History | |||||||||||||||||||||||||||||||||||||||||||||||||||||||||||||||||||||||||||||||||||||||||||||||||||||||||||||||
|
| TSC Current Stock Quote |
Get Dividend Alerts Get SEC Filing Alerts |
| TSC Stock Price Chart |
| Next Earnings Dates |
Next Earnings Date Calendar:Lithia Motors (LAD): 7/20/2022 5:00 AMComerica (CMA): 7/20/2022 6:00 AM MarketAxess Holdings (MKTX): 7/20/2022 6:30 AM M&T Bank (MTB): 7/20/2022 6:40 AM Baker Hughes (BKR): 7/20/2022 7:00 AM Biogen (BIIB): 7/20/2022 7:00 AM Nasdaq (NDAQ): 7/20/2022 7:00 AM Healthcare Services Group (HCSG): 7/20/2022 7:00 AM Abbott Laboratories (ABT): 7/20/2022 7:30 AM Berkshire Hills Bancorp (BHLB): 7/20/2022 7:30 AM More from the Next Earnings Dates Calendar Earnings History:Pinnacle Financial (PNFP): 7/19/2022 5:30 PMNational Bankshares (NKSH): 7/19/2022 After close Hope Bancorp (HOPE): 7/19/2022 After close Fulton Financial (FULT): 7/19/2022 After close United Community Banks (UCBI): 7/19/2022 After close Bank First (BFC): 7/19/2022 After close National Bank Holdings (NBHC): 7/19/2022 After close Cal-Maine Foods (CALM): 7/19/2022 After close First Horizon National (FHN): 7/19/2022 After close Aspen Group (ASPU): 7/19/2022 After close More from the Earnings History archive |
| Featured Articles |
| Earnings Peers |
| TriState Capital Holdings (TSC) is categorized under the Financials sector; to help you further research past earnings across stocks, below are some other companies in the same sector:
TW Historical Earnings TWO Historical Earnings UBA Historical Earnings UBFO Historical Earnings UBOH Historical Earnings UBSI Historical Earnings UCBI Historical Earnings UDR Historical Earnings UE Historical Earnings UFCS Historical Earnings |