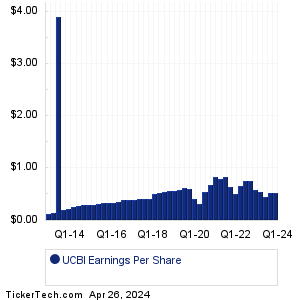
| UCBI Earnings History | ||||||||||||||||||||||||||||||||||||||||||||||||||||||||||||||||||||||||||||||||||||||||||||||||||||||||||||||||||||||||||||||||||||||||||
|
|
|
| UCBI Earnings History | ||||||||||||||||||||||||||||||||||||||||||||||||||||||||||||||||||||||||||||||||||||||||||||||||||||||||||||||||||||||||||||||||||||||||||
|
|
|
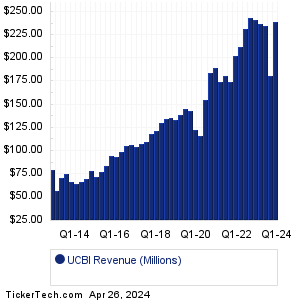
| UCBI Revenue History | ||||||||||||||||||||||||||||||||||||||||||||||||||||||||||||||||||||||||||||||||||||||||||||||||||||||||||||||||||||||||||||||||||||||||||
|
| UCBI Current Stock Quote |
Get Dividend Alerts Get SEC Filing Alerts |
| UCBI Stock Price Chart |
| Next Earnings Dates |
Next Earnings Date Calendar:AIM ImmunoTech (AIM): 4/2/2024 6:30 AMOcugen (OCGN): 4/2/2024 7:00 AM Paychex (PAYX): 4/2/2024 8:30 AM Cal-Maine Foods (CALM): 4/2/2024 After close Dave & Buster's Enter (PLAY): 4/2/2024 After close Acuity Brands (AYI): 4/3/2024 6:00 AM Resources Connection (RGP): 4/3/2024 After close Sportsman's Warehouse (SPWH): 4/3/2024 After close Simulations Plus (SLP): 4/3/2024 After close Levi Strauss (LEVI): 4/3/2024 After close More from the Next Earnings Dates Calendar Earnings History:OMNIQ (OMQS): 4/1/2024 5:11 PMSphere 3D (ANY): 4/1/2024 5:00 PM Steel Connect (STCN): 4/1/2024 5:00 PM Microvast Holdings (MVST): 4/1/2024 5:00 PM Natural Gas Services Gr (NGS): 4/1/2024 After close Canoo (GOEV): 4/1/2024 After close Terran Orbital (LLAP): 4/1/2024 After close Air Industries (AIRI): 4/1/2024 After close FlexShopper (FPAY): 4/1/2024 After close AST SpaceMobile (ASTS): 4/1/2024 After close More from the Earnings History archive |
| Featured Articles |
| Earnings Peers |
| United Community Banks (UCBI) is categorized under the Financials sector; to help you further research past earnings across stocks, below are some other companies in the same sector:
UDR Past Earnings UE Past Earnings UFCS Past Earnings UHT Past Earnings UIHC Past Earnings UMBF Past Earnings UMH Past Earnings UMPQ Past Earnings UNAM Past Earnings UNB Past Earnings |
Recommended: Funds Holding FBYD, NVR MACD, JPMV market cap history.
Click the button below for your complimentary copy of Your Early Retirement Portfolio: Dividends Up to 9.5%—Every Month—Forever.
You'll discover the details on 4 stocks and funds that pay you massive dividends as high as 9.5%.