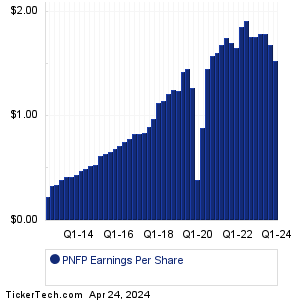
| Pinnacle Finl Partners Earnings History | |||||||||||||||||||||||||||||||||||||||||||||||||||||||||||||||||||||||||||||||||||||||||||||||||||||||||||||||||||||||||||||||||||||||
|
|
|
| Pinnacle Finl Partners Earnings History | |||||||||||||||||||||||||||||||||||||||||||||||||||||||||||||||||||||||||||||||||||||||||||||||||||||||||||||||||||||||||||||||||||||||
|
|
|
| PNFP Revenue History | |||||||||||||||||||||||||||||||||||||||||||||||||||||||||||||||||||||||||||||||||||||||||||||||||||||||||||||||||||||||||||||||||||||||

|
| PNFP Current Stock Quote |
Get Dividend Alerts Get SEC Filing Alerts |
| PNFP Stock Price Chart |
| Next Earnings Dates |
Next Earnings Date Calendar:Lithia Motors (LAD): 4/19/2023 5:00 AMElevance Health (ELV): 4/19/2023 6:00 AM Synchrony Finl (SYF): 4/19/2023 6:00 AM Citizens Financial Group (CFG): 4/19/2023 6:20 AM U.S. Bancorp (USB): 4/19/2023 6:45 AM Travelers Companies (TRV): 4/19/2023 6:57 AM Baker Hughes (BKR): 4/19/2023 7:00 AM Nasdaq (NDAQ): 4/19/2023 7:00 AM Abbott Laboratories (ABT): 4/19/2023 7:30 AM Morgan Stanley (MS): 4/19/2023 7:30 AM More from the Next Earnings Dates Calendar Earnings History:Greenidge Generation Hldg (GREE): 4/18/2023 5:00 PMSIGNIFY HEALTH INC CL A (SGFY): 4/18/2023 5:00 PM Fulton Financial (FULT): 4/18/2023 After close Equity Bancshares (EQBK): 4/18/2023 After close Western Alliance (WAL): 4/18/2023 After close United Community Banks (UCBI): 4/18/2023 After close First Horizon (FHN): 4/18/2023 After close Amcon Distributing (DIT): 4/18/2023 After close Nicolet Bankshares (NIC): 4/18/2023 After close Metropolitan Bank Holding (MCB): 4/18/2023 After close More from the Earnings History archive |
| Featured Articles |
| Earnings Peers |
| Pinnacle Finl Partners (PNFP) is categorized under the Financials sector; to help you further research past earnings across stocks, below are some other companies in the same sector:
PPBI Past Earnings PRA Past Earnings PRAA Past Earnings PRDS Past Earnings PRG Past Earnings PRI Past Earnings PROS Past Earnings PROV Past Earnings PRU Past Earnings PSA Past Earnings |
Recommended: Funds Holding JJA, EFA Videos, CSUN Options Chain.