VIVO Earnings Surprises image   This VIVO earnings surprises page last updated 2/7/2023
VIVO Earnings Surprises Chart
PeriodExpectedActualSurprise
Q4 2022 0.15 0.20 +0.05 (+33%)
Q2 2022 0.47 0.66 +0.19 (+40%)
Q1 2022 0.25 0.35 +0.10 (+40%)
Q4 2021 0.20 0.23 +0.03 (+15%)
Q3 2021 0.31 0.22 -0.09 (-29%)
Q2 2021 0.48 0.56 +0.08 (+17%)
Q1 2021 0.42 0.65 +0.23 (+55%)
Q4 2020 0.14 0.19 +0.05 (+36%)
Q2 2020 0.08 0.23 +0.15 (+188%)
Q1 2020 0.07 0.10 +0.03 (+43%)
Q4 2019 0.09 0.13 +0.04 (+44%)
Q3 2019 0.09 0.16 +0.07 (+78%)
Q2 2019 0.16 0.19 +0.03 (+19%)
Q1 2019 0.18 0.20 +0.02 (+11%)
Q4 2018 0.16 0.20 +0.04 (+25%)
Q3 2018 0.23 0.18 -0.05 (-22%)
Q2 2018 0.25 0.21 -0.04 (-16%)
Q4 2017 0.14 0.15 +0.01 (+7%)
Q3 2017 0.17 0.16 -0.01 (-6%)
Q2 2017 0.19 0.22 +0.03 (+16%)
Q1 2017 0.20 0.15 -0.05 (-25%)
Q3 2016 0.22 0.21 -0.01 (-5%)
Q4 2014 0.22 0.20 -0.02 (-9%)
Q3 2014 0.23 0.21 -0.02 (-9%)
Q2 2014 0.27 0.24 -0.03 (-11%)
Q4 2013 0.23 0.22 -0.01 (-4%)
Q3 2013 0.22 0.24 +0.02 (+9%)
Q1 2013 0.19 0.20 +0.01 (+5%)
Q4 2012 0.19 0.21 +0.02 (+11%)
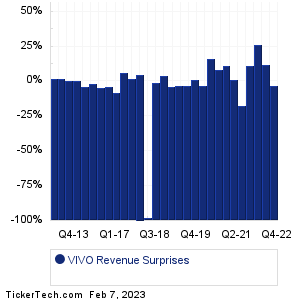
VIVO Revenue Surprises Chart
PeriodExpectedActualSurprise
Q4 2022 67.43M 65.67M -1.75M (-3%)
Q2 2022 99.54M 111.23M +11.69M (+12%)
Q1 2022 70.29M 88.34M +18.05M (+26%)
Q4 2021 68.40M 76.20M +7.80M (+11%)
Q3 2021 77.22M 63.51M -13.71M (-18%)
Q2 2021 84.48M 85.26M +784000 (+1%)
Q1 2021 83.89M 92.92M +9.03M (+11%)
Q4 2020 59.64M 64.15M +4.51M (+8%)
Q2 2020 49.26M 57.30M +8.04M (+16%)
Q1 2020 48.90M 47.42M -1.48M (-3%)
Q4 2019 50.59M 50.85M +256000 (+1%)
Q3 2019 49.81M 48.44M -1.37M (-3%)
Q2 2019 51.74M 50.25M -1.49M (-3%)
Q1 2019 53.68M 51.48M -2.20M (-4%)
Q4 2018 51.11M 53.10M +1.99M (+4%)
Q3 2018 52.12M 51.74M -0.38M (-1%)
Q2 2018 3.29B 56.45M -3.23B (+1616%)
Q4 2017 47.34M 49.70M +2.36M (+5%)
Q3 2017 49.17M 50.14M +970000 (+2%)
Q2 2017 51.16M 54.12M +2.96M (+6%)
Q1 2017 51.15M 46.81M -4.34M (-8%)
Q3 2016 52.85M 50.66M -2.19M (-4%)
Q4 2014 48.95M 46.69M -2.26M (-5%)
Q3 2014 47.96M 47.20M -0.76M (-2%)
Q2 2014 52.18M 50.10M -2.08M (-4%)
Q4 2013 49.24M 49.00M -0.24M (-0%)
Q3 2013 46.96M 47.10M +140000 (0%)
Q1 2013 44.34M 45.40M +1.06M (+2%)
Q4 2012 42.97M 43.70M +730000 (+2%)
Quotes delayed 20 minutes

Email EnvelopeFree VIVO Email Alerts:
Get Dividend Alerts
Get SEC Filing Alerts
10 Most Oversold S&P 500 Stocks
10 Most Overbought S&P 500 Stocks
10 ETFs With Stocks Insiders Are Buying
10 ETFs With Most Upside To Targets
The DividendRank Top 25
Warren Buffett Dividend Stocks
10 Cheap Dividend Stocks Under $10
10 Top DividendRank'ed Energy Stocks
The 10 Highest Yielding Preferred Stocks
The 15 Most Active S&P Call & Put Options

Next Earnings Date Calendar:

P3 Health Partners (PIII): 2/7/2023 2:39 AM
Linde (LIN): 2/7/2023 6:00 AM
Centene (CNC): 2/7/2023 6:00 AM
DuPont de Nemours (DD): 2/7/2023 6:00 AM
Gartner (IT): 2/7/2023 6:00 AM
Haemonetics (HAE): 2/7/2023 6:00 AM
BrightView Holdings (BV): 2/7/2023 6:15 AM
Carrier Global (CARR): 2/7/2023 6:30 AM
Aramark (ARMK): 2/7/2023 6:30 AM
Graphic Packaging Holding (GPK): 2/7/2023 6:30 AM

More from the Next Earnings Dates Calendar

Earnings History:

First Savings Financial (FSFG): 2/6/2023 6:50 PM
BellRing Brands (BRBR): 2/6/2023 5:00 PM
NOV (NOV): 2/6/2023 5:00 PM
Skyline Champion (SKY): 2/6/2023 After close
Enact Holdings (ACT): 2/6/2023 After close
Simpson Manufacturing Co (SSD): 2/6/2023 After close
UDR (UDR): 2/6/2023 After close
Aethlon Medical (AEMD): 2/6/2023 After close
Genworth Financial (GNW): 2/6/2023 After close
Fabrinet (FN): 2/6/2023 After close

More from the Earnings History archive
Meridian Bioscience (VIVO) is categorized under the Healthcare sector; to help you further research past earnings across stocks, below are some other companies in the same sector:

VKTX Historical Earnings
VLON Historical Earnings
VNDA Historical Earnings
VOR Historical Earnings
VRAY Historical Earnings
VRCA Historical Earnings
VRDN Historical Earnings
VREX Historical Earnings
VRPX Historical Earnings
VRTX Historical Earnings
On this page we presented the VIVO earnings surprises information for Meridian Bioscience, comparing the expected earnings versus the actual earnings quarter by quarter, with the resulting positive or negative percentage surprise. Any self directed investor doing their due diligence on VIVO (or any other given stock) can benefit from researching all of the Meridian Bioscience past earnings going backwards in time, including how often the company beat or missed the market's expectations. To help you with this Meridian Bioscience earnings surprise research, on this page we presented each quarter's resulting numbers for easy comparison. Studying these numbers can help an investor by providing important context with which to think about VIVO's next earnings report. In your continued research on Meridian Bioscience we hope you will be sure to check out the further links included for revenue and earnings history as well as next earnings dates for VIVO. Thanks for visiting, and the next time you need to research VIVO earnings surprises or those of another stock, we hope you'll think of our site as your go-to earnings surprises research resource of choice.

Recommended: Institutional Holders of BKMU, HFC Stock Predictions, MP Average Annual Return.


VIVO Earnings Surprises | www.NextEarningsDate.com | Copyright © 2020 - 2023, All Rights Reserved

Nothing in NextEarningsDate.com is intended to be investment advice, nor does it represent the opinion of, counsel from, or recommendations by BNK Invest Inc. or any of its affiliates, subsidiaries or partners. None of the information contained herein constitutes a recommendation that any particular security, portfolio, transaction, or investment strategy is suitable for any specific person. All viewers agree that under no circumstances will BNK Invest, Inc,. its subsidiaries, partners, officers, employees, affiliates, or agents be held liable for any loss or damage caused by your reliance on information obtained. By visiting, using or viewing this site, you agree to the following Full Disclaimer & Terms of Use and Privacy Policy. Video widget and market videos powered by Market News Video. Quote and option data delayed at least 15 minutes; stock quote data powered by Ticker Technologies, and Mergent.