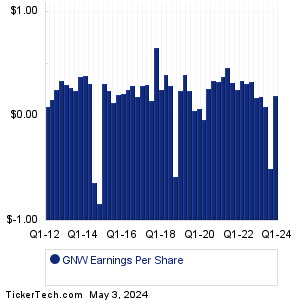
| Genworth Finl Earnings History | |||||||||||||||||||||||||||||||||||||||||||||||||||||||||||||||||||||||||||||||||||||||||||||||||||||||||||||||||||||||||||||||||||||||||||||
|
|
|
| Genworth Finl Earnings History | |||||||||||||||||||||||||||||||||||||||||||||||||||||||||||||||||||||||||||||||||||||||||||||||||||||||||||||||||||||||||||||||||||||||||||||
|
|
|
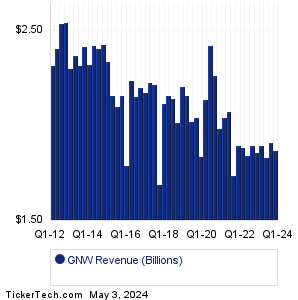
| GNW Revenue History | |||||||||||||||||||||||||||||||||||||||||||||||||||||||||||||||||||||||||||||||||||||||||||||||||||||||||||||||||||||||||||||||||||||||||||||
|
| GNW Current Stock Quote |
Get Dividend Alerts Get SEC Filing Alerts |
| GNW Stock Price Chart |
| Next Earnings Dates |
Next Earnings Date Calendar:YETI Holdings (YETI): 8/10/2023 6:00 AMNational Vision Holdings (EYE): 8/10/2023 6:00 AM Six Flags Entertainment (SIX): 8/10/2023 6:00 AM X4 Pharmaceuticals (XFOR): 8/10/2023 6:00 AM Aveanna Healthcare Hldgs (AVAH): 8/10/2023 6:00 AM Applied Industrial (AIT): 8/10/2023 6:30 AM Utz Brands (UTZ): 8/10/2023 6:30 AM Wolverine World Wide (WWW): 8/10/2023 6:30 AM Liquidia (LQDA): 8/10/2023 6:30 AM Veru (VERU): 8/10/2023 6:30 AM More from the Next Earnings Dates Calendar Earnings History:Global Water Resources (GWRS): 8/9/2023 7:25 PMNutex Health (NUTX): 8/9/2023 5:53 PM Bird Glb (BRDS): 8/9/2023 5:37 PM Delcath Systems (DCTH): 8/9/2023 5:33 PM Associated Cap Gr (AC): 8/9/2023 5:32 PM Stabilis Solutions (SLNG): 8/9/2023 5:20 PM Innovative Solns (ISSC): 8/9/2023 5:17 PM Fluence Energy (FLNC): 8/9/2023 5:13 PM Excelerate Energy (EE): 8/9/2023 5:00 PM Ginkgo Bioworks Holdings (DNA): 8/9/2023 5:00 PM More from the Earnings History archive |
| Featured Articles |
| Earnings Peers |
| Genworth Finl (GNW) is categorized under the Financials sector; to help you further research past earnings across stocks, below are some other companies in the same sector:
GOCO Past Earnings GOOD Past Earnings GPMT Past Earnings GROW Past Earnings GS Past Earnings GSBC Past Earnings GSHD Past Earnings GTY Past Earnings GWB Past Earnings HAFC Past Earnings |
Click the button below for your complimentary copy of Your Early Retirement Portfolio: Dividends Up to 7.8%—Every Month—Forever.
You'll discover the details on 4 stocks and funds that pay you massive dividends as high as 7.8%.