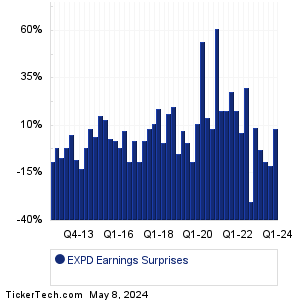
| Expeditors Intl Earnings Surprises | ||||||||||||||||||||||||||||||||||||||||||||||||||||||||||||||||||||||||||||||||||||||||||||||||||||||||||||||||||||||||||||||||||||||||||||||||||||||||||||||||||||||||||||||||
|
|
|
| Expeditors Intl Earnings Surprises | ||||||||||||||||||||||||||||||||||||||||||||||||||||||||||||||||||||||||||||||||||||||||||||||||||||||||||||||||||||||||||||||||||||||||||||||||||||||||||||||||||||||||||||||||
|
|
|
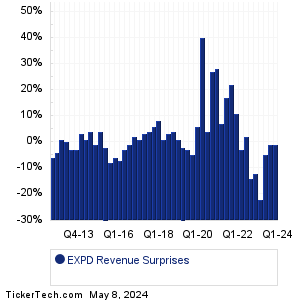
| EXPD Revenue Surprises | ||||||||||||||||||||||||||||||||||||||||||||||||||||||||||||||||||||||||||||||||||||||||||||||||||||||||||||||||||||||||||||||||||||||||||||||||||||||||||||||||||||||||||||||||
|
| EXPD Current Stock Quote |
Get Dividend Alerts Get SEC Filing Alerts |
| EXPD Stock Price Chart |
| Next Earnings Dates |
Next Earnings Date Calendar:Lamar Advertising (LAMR): 5/4/2023 5:00 AMBall (BALL): 5/4/2023 6:00 AM Targa Resources (TRGP): 5/4/2023 6:00 AM Stanley Black & Decker (SWK): 5/4/2023 6:00 AM WESCO Intl (WCC): 5/4/2023 6:00 AM NovoCure (NVCR): 5/4/2023 6:00 AM Vontier (VNT): 5/4/2023 6:00 AM XPO (XPO): 5/4/2023 6:00 AM Prestige Consumer (PBH): 5/4/2023 6:00 AM ACI Worldwide (ACIW): 5/4/2023 6:00 AM More from the Next Earnings Dates Calendar Earnings History:Radian Group (RDN): 5/3/2023 5:57 PMMosaic (MOS): 5/3/2023 5:15 PM United States Lime (USLM): 5/3/2023 5:14 PM Earthstone Energy (ESTE): 5/3/2023 5:05 PM Sturm Ruger & Co (RGR): 5/3/2023 5:05 PM Via Renewables (VIA): 5/3/2023 5:00 PM Titan Intl (TWI): 5/3/2023 5:00 PM Callon Petroleum (CPE): 5/3/2023 5:00 PM Corteva (CTVA): 5/3/2023 5:00 PM Chesapeake Utilities (CPK): 5/3/2023 After close More from the Earnings History archive |
| Earnings Peers |
| Expeditors Intl (EXPD) is categorized under the Industrials sector; to help you further research past earnings across stocks, below are some other companies in the same sector:
EXPO Historical Earnings FC Historical Earnings FCEL Historical Earnings FCN Historical Earnings FDX Historical Earnings FELE Historical Earnings FICO Historical Earnings FIP Historical Earnings FIS Historical Earnings FIX Historical Earnings |