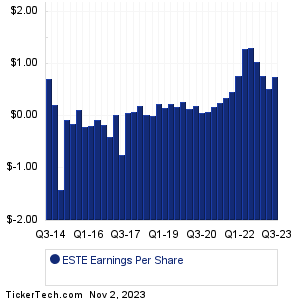
| ESTE Earnings History | |||||||||||||||||||||||||||||||||||||||||||||||||||||||||||||||||||||||||||||||||||||||||||||||||||||||||||||||||||||
|
|
|
| ESTE Earnings History | |||||||||||||||||||||||||||||||||||||||||||||||||||||||||||||||||||||||||||||||||||||||||||||||||||||||||||||||||||||
|
|
|
| ESTE Revenue History | |||||||||||||||||||||||||||||||||||||||||||||||||||||||||||||||||||||||||||||||||||||||||||||||||||||||||||||||||||||

|
| ESTE Current Stock Quote |
Get Dividend Alerts Get SEC Filing Alerts |
| ESTE Stock Price Chart |
| Next Earnings Dates |
Next Earnings Date Calendar:Starbucks (SBUX): 11/2/2023 6:00 AMCigna Group (CI): 11/2/2023 6:00 AM Targa Resources (TRGP): 11/2/2023 6:00 AM Ball (BALL): 11/2/2023 6:00 AM EPAM Sys (EPAM): 11/2/2023 6:00 AM Entegris (ENTG): 11/2/2023 6:00 AM KBR (KBR): 11/2/2023 6:00 AM WESCO Intl (WCC): 11/2/2023 6:00 AM Lamar Advertising (LAMR): 11/2/2023 6:00 AM Dentsply Sirona (XRAY): 11/2/2023 6:00 AM More from the Next Earnings Dates Calendar Earnings History:California Resources (CRC): 11/1/2023 5:26 PMCore Laboratories (CLB): 11/1/2023 5:15 PM InvenTrust Properties (IVT): 11/1/2023 5:12 PM Sturm Ruger & Co (RGR): 11/1/2023 5:05 PM Via Renewables (VIA): 11/1/2023 5:00 PM Viemed Healthcare (VMD): 11/1/2023 5:00 PM Seacor Marine Hldgs (SMHI): 11/1/2023 5:00 PM LSI Industries (LYTS): 11/1/2023 5:00 PM Hudson Pacific Properties (HPP): 11/1/2023 5:00 PM Vector Group (VGR): 11/1/2023 5:00 PM More from the Earnings History archive |
| Featured Articles |
| Earnings Peers |
| Earthstone Energy (ESTE) is categorized under the Energy sector; to help you further research past earnings across stocks, below are some other companies in the same sector:
EXTN Past Earnings FANG Past Earnings FET Past Earnings FLMN Past Earnings FTI Past Earnings FTSI Past Earnings GEOS Past Earnings GEVO Past Earnings GLNG Past Earnings GPOR Past Earnings |
Recommended: ATER YTD Return, Top Ten Hedge Funds Holding APW, WSFS Price Target.
Click the button below for your complimentary copy of Your Early Retirement Portfolio: Dividends Up to 8.1%—Every Month—Forever.
You'll discover the details on 4 stocks and funds that pay you massive dividends as high as 8.1%.