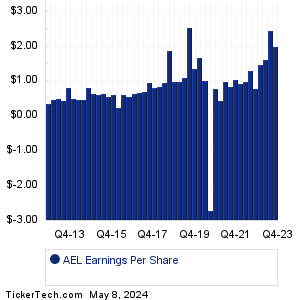
| American Equity Inv Earnings History | |||||||||||||||||||||||||||||||||||||||||||||||||||||||||||||||||||||||||||||||||||||||||||||||||||||||||||||||||||||||||||||||||||||||||||||
|
|
|
| American Equity Inv Earnings History | |||||||||||||||||||||||||||||||||||||||||||||||||||||||||||||||||||||||||||||||||||||||||||||||||||||||||||||||||||||||||||||||||||||||||||||
|
|
|
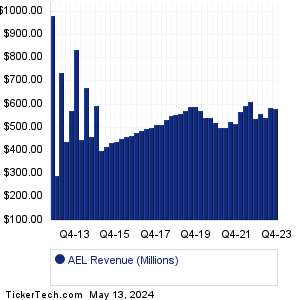
| AEL Revenue History | |||||||||||||||||||||||||||||||||||||||||||||||||||||||||||||||||||||||||||||||||||||||||||||||||||||||||||||||||||||||||||||||||||||||||||||
|
| AEL Current Stock Quote |
Get Dividend Alerts Get SEC Filing Alerts |
| AEL Stock Price Chart |
| Next Earnings Dates |
Next Earnings Date Calendar:Archer-Daniels Midland (ADM): 3/12/2024 7:00 AMTupperware Brands (TUP): 3/12/2024 7:00 AM BioXcel Therapeutics (BTAI): 3/12/2024 7:00 AM Priority Tech Holdings (PRTH): 3/12/2024 7:00 AM Chicago Atlantic Real (REFI): 3/12/2024 7:00 AM Hagerty (HGTY): 3/12/2024 7:00 AM Bioventus (BVS): 3/12/2024 7:00 AM PowerFleet (PWFL): 3/12/2024 7:00 AM Lifetime Brands (LCUT): 3/12/2024 7:00 AM Kohl's (KSS): 3/12/2024 7:00 AM More from the Next Earnings Dates Calendar Earnings History:Energy Fuels (UUUU): 3/11/2024 6:00 PMNN (NNBR): 3/11/2024 5:05 PM Smart Sand (SND): 3/11/2024 5:00 PM Fuel Tech (FTEK): 3/11/2024 After close Casey's General Stores (CASY): 3/11/2024 After close NET Power (NPWR): 3/11/2024 After close PLAYSTUDIOS (MYPS): 3/11/2024 After close NGM Biopharmaceuticals (NGM): 3/11/2024 After close Heritage Insurance Hldgs (HRTG): 3/11/2024 After close Olema Pharmaceuticals (OLMA): 3/11/2024 After close More from the Earnings History archive |
| Featured Articles |
| Earnings Peers |
| American Equity Inv (AEL) is categorized under the Financials sector; to help you further research past earnings across stocks, below are some other companies in the same sector:
AFBI Past Earnings AFCG Past Earnings AFG Past Earnings AFIN Past Earnings AFL Past Earnings AGM Past Earnings AGNC Past Earnings AGO Past Earnings AHH Past Earnings AHT Past Earnings |
Click the button below for your complimentary copy of Your Early Retirement Portfolio: Dividends Up to 9.5%—Every Month—Forever.
You'll discover the details on 4 stocks and funds that pay you massive dividends as high as 9.5%.