| Abiomed Earnings Surprises | ||||||||||||||||||||||||||||||||||||||||||||||||||||||||||||||||||||||||||||||||||||||||||||||||||||||||||||||||||||||||||||||||||||||||||||||||||||||||||||||||

|
|
|
| Abiomed Earnings Surprises | ||||||||||||||||||||||||||||||||||||||||||||||||||||||||||||||||||||||||||||||||||||||||||||||||||||||||||||||||||||||||||||||||||||||||||||||||||||||||||||||||
|
|
|
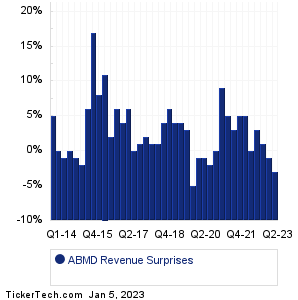
| ABMD Revenue Surprises | ||||||||||||||||||||||||||||||||||||||||||||||||||||||||||||||||||||||||||||||||||||||||||||||||||||||||||||||||||||||||||||||||||||||||||||||||||||||||||||||||
|
| ABMD Current Stock Quote |
Get Dividend Alerts Get SEC Filing Alerts |
| ABMD Stock Price Chart |
| Next Earnings Dates |
Next Earnings Date Calendar:MSC Industrial Direct Co (MSM): 1/5/2023 6:30 AMPark Aerospace (PKE): 1/5/2023 6:30 AM RPM International (RPM): 1/5/2023 6:45 AM Helen Of Troy (HELE): 1/5/2023 6:45 AM Lindsay (LNN): 1/5/2023 6:45 AM Walgreens Boots Alliance (WBA): 1/5/2023 7:00 AM Simply Good Foods (SMPL): 1/5/2023 7:00 AM AngioDynamics (ANGO): 1/5/2023 7:00 AM Constellation Brands (STZ): 1/5/2023 7:30 AM Conagra Brands (CAG): 1/5/2023 7:30 AM More from the Next Earnings Dates Calendar Earnings History:Richardson Electronics (RELL): 1/4/2023 After closeResources Connection (RGP): 1/4/2023 After close Simulations Plus (SLP): 1/4/2023 After close UniFirst (UNF): 1/4/2023 8:12 AM SMART Global Holdings (SGH): 1/3/2023 After close SRAX (SRAX): 1/3/2023 11:49 AM Virgin Orbit Holdings (VORB): 12/30/2022 6:36 PM Barnwell Industries (BRN): 12/29/2022 6:23 PM UpHealth (UPH): 12/29/2022 6:22 PM Mesa Air Group (MESA): 12/29/2022 After close More from the Earnings History archive |
| Earnings Peers |
| Abiomed (ABMD) is categorized under the Healthcare sector; to help you further research past earnings across stocks, below are some other companies in the same sector:
ABOS Historical Earnings ABSI Historical Earnings ABT Historical Earnings ABVC Historical Earnings ACAD Historical Earnings ACCD Historical Earnings ACER Historical Earnings ACET Historical Earnings ACHC Historical Earnings ACHV Historical Earnings |
Recommended: FRPT market cap history, ASEI Videos, SGLB Insider Buying.