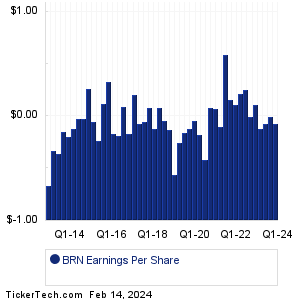
| Barnwell Industries Earnings History | |||||||||||||||||||||||||||||||||||||||||||||||||||||||||||||||||||||||||||||||||||||||||||||||||||||||||||||||||||||||||||||||||||||||||||||
|
|
|
| Barnwell Industries Earnings History | |||||||||||||||||||||||||||||||||||||||||||||||||||||||||||||||||||||||||||||||||||||||||||||||||||||||||||||||||||||||||||||||||||||||||||||
|
|
|
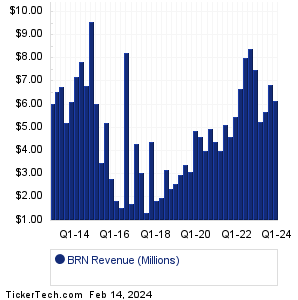
| BRN Revenue History | |||||||||||||||||||||||||||||||||||||||||||||||||||||||||||||||||||||||||||||||||||||||||||||||||||||||||||||||||||||||||||||||||||||||||||||
|
| BRN Current Stock Quote |
Get Dividend Alerts Get SEC Filing Alerts |
| BRN Stock Price Chart |
| Next Earnings Dates |
Next Earnings Date Calendar:Lithia Motors (LAD): 2/14/2024 5:00 AMOwens-Corning (OC): 2/14/2024 6:00 AM Generac Hldgs (GNRC): 2/14/2024 6:00 AM SiteOne Landscape Supply (SITE): 2/14/2024 6:00 AM Louisiana-Pacific (LPX): 2/14/2024 6:00 AM Crown Crafts (CRWS): 2/14/2024 6:02 AM Avantor (AVTR): 2/14/2024 6:05 AM Avient (AVNT): 2/14/2024 6:05 AM Taylor Morrison Home (TMHC): 2/14/2024 6:15 AM Westinghouse Air Brake (WAB): 2/14/2024 6:30 AM More from the Next Earnings Dates Calendar Earnings History:Encore Wire (WIRE): 2/13/2024 5:05 PMMEI Pharma (MEIP): 2/13/2024 5:05 PM National Research (NRC): 2/13/2024 5:00 PM Vector Group (VGR): 2/13/2024 5:00 PM Gold Resource (GORO): 2/13/2024 5:00 PM Innospec (IOSP): 2/13/2024 After close Community Healthcare (CHCT): 2/13/2024 After close Genasys (GNSS): 2/13/2024 After close Rush Enterprises (RUSHA): 2/13/2024 After close Modular Medical (MODD): 2/13/2024 After close More from the Earnings History archive |
| Featured Articles |
| Earnings Peers |
Recommended: PT Videos, SNA Next Dividend Date, TENX market cap history.
Click the button below for your complimentary copy of Your Early Retirement Portfolio: Dividends Up to 9.5%—Every Month—Forever.
You'll discover the details on 4 stocks and funds that pay you massive dividends as high as 9.5%.