| Yield10 Bioscience Earnings History | ||||||||||||||||||||||||||||||||||||||||||||||||||||||||||||||||||||||||||||||||||||||||||||||||||||||||||||||||||||||||||||||||||||||||||

|
|
|
| Yield10 Bioscience Earnings History | ||||||||||||||||||||||||||||||||||||||||||||||||||||||||||||||||||||||||||||||||||||||||||||||||||||||||||||||||||||||||||||||||||||||||||
|
|
|
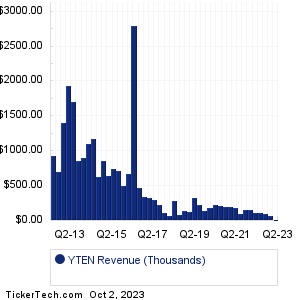
| YTEN Revenue History | ||||||||||||||||||||||||||||||||||||||||||||||||||||||||||||||||||||||||||||||||||||||||||||||||||||||||||||||||||||||||||||||||||||||||||
|
| YTEN Current Stock Quote |
Get Dividend Alerts Get SEC Filing Alerts |
| YTEN Stock Price Chart |
| Next Earnings Dates |
Next Earnings Date Calendar:Upexi (UPXI): 10/2/2023 After closeMcCormick & Co (MKC): 10/3/2023 6:30 AM Cal-Maine Foods (CALM): 10/3/2023 After close Acuity Brands (AYI): 10/4/2023 6:00 AM RPM International (RPM): 10/4/2023 6:45 AM Helen Of Troy (HELE): 10/4/2023 6:45 AM AngioDynamics (ANGO): 10/4/2023 7:00 AM Accolade (ACCD): 10/4/2023 After close Resources Connection (RGP): 10/4/2023 After close Constellation Brands (STZ): 10/5/2023 7:30 AM More from the Next Earnings Dates Calendar Earnings History:BioSig Technologies (BSGM): 9/29/2023 After closeCarnival (CCL): 9/29/2023 9:15 AM Taylor Devices (TAYD): 9/29/2023 7:45 AM Polished.com (POL): 9/29/2023 7:00 AM Circor International (CIR): 9/29/2023 6:00 AM Precision Optics Corp (POCI): 9/28/2023 After close Nike (NKE): 9/28/2023 After close Park City Gr (PCYG): 9/28/2023 After close Vail Resorts (MTN): 9/28/2023 After close Glimpse Group (VRAR): 9/28/2023 After close More from the Earnings History archive |
| Featured Articles |
| Earnings Peers |
| Yield10 Bioscience (YTEN) is categorized under the Healthcare sector; to help you further research past earnings across stocks, below are some other companies in the same sector:
ZBH Past Earnings ZGNX Past Earnings ZIMV Past Earnings ZIOP Past Earnings ZNTL Past Earnings ZSAN Past Earnings ZTS Past Earnings ZVRA Past Earnings ZY Past Earnings ZYME Past Earnings |
Recommended: NUC Videos, ENO Historical Stock Prices, GLAQ Historical Stock Prices.
Click the button below for your complimentary copy of Your Early Retirement Portfolio: Dividends Up to 8.1%—Every Month—Forever.
You'll discover the details on 4 stocks and funds that pay you massive dividends as high as 8.1%.