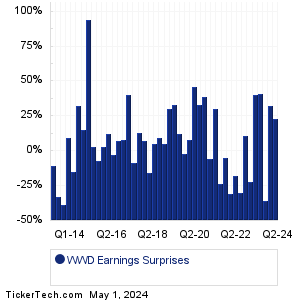
| WWD Earnings Surprises | ||||||||||||||||||||||||||||||||||||||||||||||||||||||||||||||||||||||||||||||||||||||||||||||||||||||||||||||||||||||||||||||||||||||||||||||||||||||||||||||||||||||||||||||||||||
|
|
|
| WWD Earnings Surprises | ||||||||||||||||||||||||||||||||||||||||||||||||||||||||||||||||||||||||||||||||||||||||||||||||||||||||||||||||||||||||||||||||||||||||||||||||||||||||||||||||||||||||||||||||||||
|
|
|
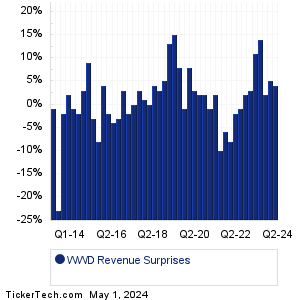
| WWD Revenue Surprises | ||||||||||||||||||||||||||||||||||||||||||||||||||||||||||||||||||||||||||||||||||||||||||||||||||||||||||||||||||||||||||||||||||||||||||||||||||||||||||||||||||||||||||||||||||||
|
| WWD Current Stock Quote |
Get Dividend Alerts Get SEC Filing Alerts |
| WWD Stock Price Chart |
| Next Earnings Dates |
Next Earnings Date Calendar:Bullfrog AI Hldgs (BFRG): 4/16/2024 2:33 AMFirst Seacoast Bancorp (FSEA): 4/16/2024 3:00 AM Mercantile Bank (MBWM): 4/16/2024 5:01 AM UnitedHealth Group (UNH): 4/16/2024 5:55 AM Commerce Bancshares (CBSH): 4/16/2024 6:00 AM Elicio Therapeutics (ELTX): 4/16/2024 6:00 AM Johnson & Johnson (JNJ): 4/16/2024 6:20 AM Bank of New York Mellon (BK): 4/16/2024 6:30 AM Bank of America (BAC): 4/16/2024 6:45 AM PNC Finl Servs Gr (PNC): 4/16/2024 6:45 AM More from the Next Earnings Dates Calendar Earnings History:Cryo-Cell International (CCEL): 4/15/2024 5:00 PMTSR (TSRI): 4/15/2024 5:00 PM Novo Integrated Sciences (NVOS): 4/15/2024 After close Jewett-Cameron Trading (JCTCF): 4/15/2024 After close Greenwich LifeSciences (GLSI): 4/15/2024 After close Vuzix (VUZI): 4/15/2024 After close FB Financial (FBK): 4/15/2024 After close Dragonfly Energy Hldgs (DFLI): 4/15/2024 After close CaliberCos (CWD): 4/15/2024 After close Bitcoin Depot (BTM): 4/15/2024 After close More from the Earnings History archive |
| Earnings Peers |
| Woodward (WWD) is categorized under the Industrials sector; to help you further research past earnings across stocks, below are some other companies in the same sector:
WWR Historical Earnings XELA Historical Earnings XMTR Historical Earnings XONE Historical Earnings XPO Historical Earnings XYL Historical Earnings YELL Historical Earnings ZWS Historical Earnings AAL Historical Earnings AAON Historical Earnings |
Recommended: HOTR Insider Buying, Funds Holding VISA, EGY Dividend History.
Click the button below for your complimentary copy of Your Early Retirement Portfolio: Dividends Up to 8.7%—Every Month—Forever.
You'll discover the details on 4 stocks and funds that pay you massive dividends as high as 8.7%.