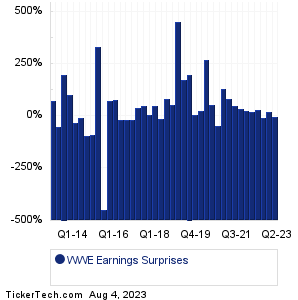
| World Wrestling Enter Earnings Surprises | ||||||||||||||||||||||||||||||||||||||||||||||||||||||||||||||||||||||||||||||||||||||||||||||||||||||||||||||||||||||||||||||||||||||||||||||||||||||||||||||||||||
|
|
|
| World Wrestling Enter Earnings Surprises | ||||||||||||||||||||||||||||||||||||||||||||||||||||||||||||||||||||||||||||||||||||||||||||||||||||||||||||||||||||||||||||||||||||||||||||||||||||||||||||||||||||
|
|
|
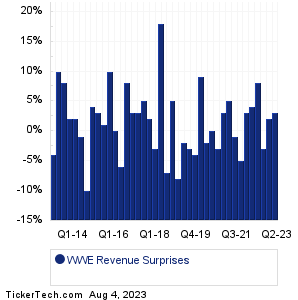
| WWE Revenue Surprises | ||||||||||||||||||||||||||||||||||||||||||||||||||||||||||||||||||||||||||||||||||||||||||||||||||||||||||||||||||||||||||||||||||||||||||||||||||||||||||||||||||||
|
| WWE Current Stock Quote |
Get Dividend Alerts Get SEC Filing Alerts |
| WWE Stock Price Chart |
| Next Earnings Dates |
Next Earnings Date Calendar:Interface (TILE): 8/4/2023 5:30 AMEvergy (EVRG): 8/4/2023 6:00 AM XPO (XPO): 8/4/2023 6:00 AM Corebridge Financial (CRBG): 8/4/2023 6:00 AM Proto Labs (PRLB): 8/4/2023 6:00 AM Gray Television (GTN): 8/4/2023 6:00 AM Amneal Pharmaceuticals (AMRX): 8/4/2023 6:00 AM Dixie Gr (DXYN): 8/4/2023 6:00 AM Marcus & Millichap (MMI): 8/4/2023 6:10 AM LyondellBasell Industries (LYB): 8/4/2023 6:30 AM More from the Next Earnings Dates Calendar Earnings History:Ziff Davis (ZD): 8/3/2023 6:44 PMAlliant Energy (LNT): 8/3/2023 6:00 PM RLJ Lodging (RLJ): 8/3/2023 5:33 PM RGC Resources (RGCO): 8/3/2023 5:30 PM Air Transport Services Gr (ATSG): 8/3/2023 5:26 PM AES (AES): 8/3/2023 5:18 PM Nine Energy Service (NINE): 8/3/2023 5:05 PM Tucows (TCX): 8/3/2023 5:05 PM Vector Group (VGR): 8/3/2023 5:03 PM NN (NNBR): 8/3/2023 5:00 PM More from the Earnings History archive |
| Earnings Peers |
| World Wrestling Enter (WWE) is categorized under the Services sector; to help you further research past earnings across stocks, below are some other companies in the same sector:
WYNN Historical Earnings XELB Historical Earnings XPER Historical Earnings XPOF Historical Earnings XSPA Historical Earnings YELP Historical Earnings YUM Historical Earnings YUMC Historical Earnings ZD Historical Earnings ZUMZ Historical Earnings |
Click the button below for your complimentary copy of Your Early Retirement Portfolio: Dividends Up to 7.8%—Every Month—Forever.
You'll discover the details on 4 stocks and funds that pay you massive dividends as high as 7.8%.