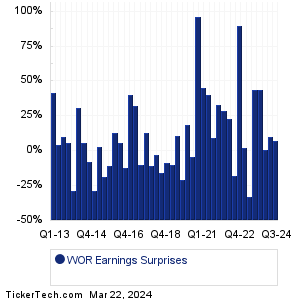
| WOR Earnings Surprises | ||||||||||||||||||||||||||||||||||||||||||||||||||||||||||||||||||||||||||||||||||||||||||||||||||||||||||||||||||||||||||||||||||||||||||||||||||||||||||||||||||||||||||||||||||||
|
|
|
| WOR Earnings Surprises | ||||||||||||||||||||||||||||||||||||||||||||||||||||||||||||||||||||||||||||||||||||||||||||||||||||||||||||||||||||||||||||||||||||||||||||||||||||||||||||||||||||||||||||||||||||
|
|
|
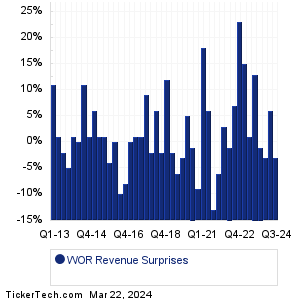
| WOR Revenue Surprises | ||||||||||||||||||||||||||||||||||||||||||||||||||||||||||||||||||||||||||||||||||||||||||||||||||||||||||||||||||||||||||||||||||||||||||||||||||||||||||||||||||||||||||||||||||||
|
| WOR Current Stock Quote |
Get Dividend Alerts Get SEC Filing Alerts |
| WOR Stock Price Chart |
| Next Earnings Dates |
Next Earnings Date Calendar:Hyzon Motors (HYZN): 3/22/2024 6:00 AMHumacyte (HUMA): 3/22/2024 7:00 AM AstroNova (ALOT): 3/22/2024 7:30 AM Star Equity Hldgs (STRR): 3/22/2024 8:30 AM Union Bankshares (UNB): 3/22/2024 2:00 PM Pliant Therapeutics (PLRX): 3/22/2024 After close Zymeworks (ZYME): 3/22/2024 After close Luther Burbank (LBC): 3/22/2024 After close Moleculin Biotech (MBRX): 3/22/2024 After close Radiant Logistics (RLGT): 3/25/2024 8:00 AM More from the Next Earnings Dates Calendar Earnings History:Instil Bio (TIL): 3/21/2024 5:00 PMBTCS (BTCS): 3/21/2024 After close MAIA Biotechnology (MAIA): 3/21/2024 After close Cibus (CBUS): 3/21/2024 After close Nike (NKE): 3/21/2024 After close Worthington Steel (WS): 3/21/2024 After close FedEx (FDX): 3/21/2024 After close Senti Biosciences (SNTI): 3/21/2024 After close Armata Pharmaceuticals (ARMP): 3/21/2024 After close Regulus Therapeutics (RGLS): 3/21/2024 After close More from the Earnings History archive |
| Earnings Peers |
| Worthington Industries (WOR) is categorized under the Materials sector; to help you further research past earnings across stocks, below are some other companies in the same sector:
WRK Historical Earnings WULF Historical Earnings X Historical Earnings YHGJ Historical Earnings ZEUS Historical Earnings AA Historical Earnings ADES Historical Earnings AFI Historical Earnings AGFS Historical Earnings ALB Historical Earnings |
Click the button below for your complimentary copy of Your Early Retirement Portfolio: Dividends Up to 9.5%—Every Month—Forever.
You'll discover the details on 4 stocks and funds that pay you massive dividends as high as 9.5%.