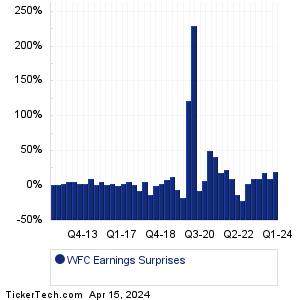
| Wells Fargo Earnings Surprises | ||||||||||||||||||||||||||||||||||||||||||||||||||||||||||||||||||||||||||||||||||||||||||||||||||||||||||||||||||||||||||||||||||||||||||||||||||||||||||||||||||||||||||||
|
|
|
| Wells Fargo Earnings Surprises | ||||||||||||||||||||||||||||||||||||||||||||||||||||||||||||||||||||||||||||||||||||||||||||||||||||||||||||||||||||||||||||||||||||||||||||||||||||||||||||||||||||||||||||
|
|
|
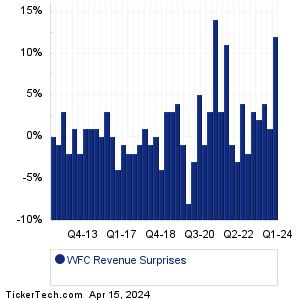
| WFC Revenue Surprises | ||||||||||||||||||||||||||||||||||||||||||||||||||||||||||||||||||||||||||||||||||||||||||||||||||||||||||||||||||||||||||||||||||||||||||||||||||||||||||||||||||||||||||||
|
| WFC Current Stock Quote |
Get Dividend Alerts Get SEC Filing Alerts |
| WFC Stock Price Chart |
| Next Earnings Dates |
Next Earnings Date Calendar:M&T Bank (MTB): 4/15/2024 6:05 AMGuaranty Bancshares (GNTY): 4/15/2024 7:00 AM Goldman Sachs Gr (GS): 4/15/2024 7:30 AM Charles Schwab (SCHW): 4/15/2024 8:00 AM CaliberCos (CWD): 4/15/2024 8:00 AM FB Financial (FBK): 4/15/2024 After close Ryvyl (RVYL): 4/15/2024 After close Vuzix (VUZI): 4/15/2024 After close Mitek Systems (MITK): 4/15/2024 After close CrossFirst Bankshares (CFB): 4/15/2024 After close More from the Next Earnings Dates Calendar Earnings History:DXP Enterprises (DXPE): 4/12/2024 6:00 PMBiomerica (BMRA): 4/12/2024 5:01 PM KULR Tech Gr (KULR): 4/12/2024 After close Hingham Institution (HIFS): 4/12/2024 After close DSS (DSS): 4/12/2024 After close Kineta (KA): 4/12/2024 After close Hycroft Mining Holding (HYMC): 4/12/2024 After close Virco Mfg (VIRC): 4/12/2024 9:00 AM Progressive (PGR): 4/12/2024 8:21 AM Bank7 (BSVN): 4/12/2024 8:01 AM More from the Earnings History archive |
| Earnings Peers |
| Wells Fargo (WFC) is categorized under the Financials sector; to help you further research past earnings across stocks, below are some other companies in the same sector:
WHG Historical Earnings WHLR Historical Earnings WMC Historical Earnings WMPN Historical Earnings WNEB Historical Earnings WPC Historical Earnings WPG Historical Earnings WRB Historical Earnings WRE Historical Earnings WRI Historical Earnings |
Recommended: CODX Stock Predictions, ILF Videos, Top Ten Hedge Funds Holding KOMP.
Click the button below for your complimentary copy of Your Early Retirement Portfolio: Dividends Up to 8.7%—Every Month—Forever.
You'll discover the details on 4 stocks and funds that pay you massive dividends as high as 8.7%.