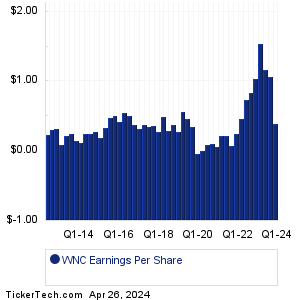
| Wabash National Earnings History | ||||||||||||||||||||||||||||||||||||||||||||||||||||||||||||||||||||||||||||||||||||||||||||||||||||||||||||||||||||||||||||||||||||||||||||||||
|
|
|
| Wabash National Earnings History | ||||||||||||||||||||||||||||||||||||||||||||||||||||||||||||||||||||||||||||||||||||||||||||||||||||||||||||||||||||||||||||||||||||||||||||||||
|
|
|
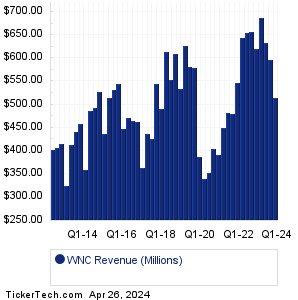
| WNC Revenue History | ||||||||||||||||||||||||||||||||||||||||||||||||||||||||||||||||||||||||||||||||||||||||||||||||||||||||||||||||||||||||||||||||||||||||||||||||
|
| WNC Current Stock Quote |
Get Dividend Alerts Get SEC Filing Alerts |
| WNC Stock Price Chart |
| Next Earnings Dates |
Next Earnings Date Calendar:RPM International (RPM): 4/4/2024 6:45 AMLindsay (LNN): 4/4/2024 6:45 AM Simply Good Foods (SMPL): 4/4/2024 7:00 AM AngioDynamics (ANGO): 4/4/2024 7:00 AM Conagra Brands (CAG): 4/4/2024 7:30 AM Schnitzer Steel (RDUS): 4/4/2024 8:00 AM VAALCO Energy (EGY): 4/4/2024 8:00 AM Lamb Weston Hldgs (LW): 4/4/2024 8:30 AM Conifer Holdings (CNFR): 4/4/2024 After close Kura Sushi USA (KRUS): 4/4/2024 After close More from the Next Earnings Dates Calendar Earnings History:Resources Connection (RGP): 4/3/2024 After closeBM Technologies (BMTX): 4/3/2024 After close Levi Strauss (LEVI): 4/3/2024 After close Simulations Plus (SLP): 4/3/2024 After close Sportsman's Warehouse (SPWH): 4/3/2024 After close Bassett Furniture Indus (BSET): 4/3/2024 9:00 AM Acuity Brands (AYI): 4/3/2024 6:00 AM Fluent (FLNT): 4/2/2024 After close Dave & Buster's Enter (PLAY): 4/2/2024 After close Cal-Maine Foods (CALM): 4/2/2024 After close More from the Earnings History archive |
| Featured Articles |
| Earnings Peers |
| Wabash National (WNC) is categorized under the Consumer sector; to help you further research past earnings across stocks, below are some other companies in the same sector:
WTER Past Earnings WVVI Past Earnings WWW Past Earnings XL Past Earnings XPEL Past Earnings XPON Past Earnings XXII Past Earnings YETI Past Earnings ZEV Past Earnings ZIVO Past Earnings |
Recommended: DOMH Historical Stock Prices, Funds Holding PTIE, Funds Holding FSLY.
Click the button below for your complimentary copy of Your Early Retirement Portfolio: Dividends Up to 9.5%—Every Month—Forever.
You'll discover the details on 4 stocks and funds that pay you massive dividends as high as 9.5%.