W R Grace Earnings Surprises image   This GRA earnings surprises page last updated 10/18/2021
W R Grace Earnings Surprises Chart
Data adjusted for GRA split history
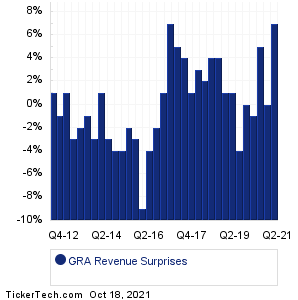
PeriodExpectedActualSurprise
Q2 2021 0.95 1.01 +0.06 (+6%)
Q4 2020 0.86 0.88 +0.02 (+2%)
Q2 2020 0.47 0.49 +0.02 (+4%)
Q1 2020 0.68 0.71 +0.03 (+4%)
Q4 2019 1.26 1.31 +0.05 (+4%)
Q3 2019 0.91 0.98 +0.07 (+8%)
Q2 2019 1.14 1.16 +0.02 (+2%)
Q1 2019 0.89 0.93 +0.04 (+4%)
Q4 2018 1.04 1.14 +0.10 (+10%)
Q3 2018 1.02 1.11 +0.09 (+9%)
Q2 2018 0.95 1.07 +0.12 (+13%)
Q1 2018 0.73 0.82 +0.09 (+12%)
Q4 2017 0.97 0.98 +0.01 (+1%)
Q3 2017 0.86 0.90 +0.04 (+5%)
Q2 2017 0.80 0.84 +0.04 (+5%)
Q1 2017 0.64 0.68 +0.04 (+6%)
Q4 2016 0.94 0.95 +0.01 (+1%)
Q3 2016 0.77 0.80 +0.03 (+4%)
Q2 2016 0.68 0.74 +0.06 (+9%)
Q1 2016 0.55 0.57 +0.02 (+4%)
Q4 2015 1.32 1.40 +0.08 (+6%)
Q3 2015 1.20 1.37 +0.17 (+14%)
Q2 2015 1.18 1.19 +0.01 (+1%)
Q4 2014 1.25 1.37 +0.12 (+10%)
Q2 2014 1.16 1.22 +0.06 (+5%)
Q1 2014 0.74 0.77 +0.03 (+4%)
Q4 2013 1.08 1.09 +0.01 (+1%)
Q3 2013 1.02 1.07 +0.05 (+5%)
Q2 2013 1.09 1.12 +0.03 (+3%)
Q1 2013 0.80 0.81 +0.01 (+1%)
Q4 2012 1.06 1.11 +0.05 (+5%)
Q3 2012 1.01 1.04 +0.03 (+3%)
Q2 2012 1.11 1.14 +0.03 (+3%)
W R Grace Revenue Surprises Chart
PeriodExpectedActualSurprise
Q2 2021 480.85M 512.90M +32.05M (+7%)
Q4 2020 467.91M 470.20M +2.29M (0%)
Q2 2020 398.81M 418.70M +19.89M (+5%)
Q1 2020 425.92M 421.50M -4.42M (-1%)
Q4 2019 503.64M 504.50M +860000 (0%)
Q3 2019 489.56M 470.50M -19.06M (-4%)
Q2 2019 507.06M 513.60M +6.54M (+1%)
Q1 2019 465.99M 469.50M +3.51M (+1%)
Q4 2018 498.42M 520.00M +21.58M (+4%)
Q3 2018 474.18M 494.90M +20.72M (+4%)
Q2 2018 476.44M 485.70M +9.26M (+2%)
Q1 2018 418.95M 431.50M +12.55M (+3%)
Q4 2017 453.45M 459.50M +6.05M (+1%)
Q3 2017 412.10M 429.50M +17.40M (+4%)
Q2 2017 407.86M 429.50M +21.64M (+5%)
Q1 2017 372.41M 398.00M +25.59M (+7%)
Q4 2016 438.05M 440.80M +2.75M (+1%)
Q3 2016 412.05M 404.50M -7.55M (-2%)
Q2 2016 407.36M 390.50M -16.86M (-4%)
Q1 2016 396.67M 362.80M -33.87M (-9%)
Q4 2015 786.19M 758.70M -27.49M (-3%)
Q3 2015 802.74M 790.10M -12.64M (-2%)
Q2 2015 815.28M 782.10M -33.18M (-4%)
Q4 2014 835.91M 804.10M -31.81M (-4%)
Q2 2014 863.79M 838.00M -25.79M (-3%)
Q1 2014 739.13M 744.50M +5.37M (+1%)
Q4 2013 798.99M 776.70M -22.29M (-3%)
Q3 2013 780.21M 771.30M -8.91M (-1%)
Q2 2013 820.35M 802.80M -17.55M (-2%)
Q1 2013 730.02M 709.90M -20.12M (-3%)
Q4 2012 790.13M 797.80M +7.67M (+1%)
Q3 2012 785.75M 776.60M -9.15M (-1%)
Q2 2012 816.20M 826.70M +10.50M (+1%)
Quotes delayed 20 minutes

Email EnvelopeFree GRA Email Alerts:
Get Dividend Alerts
Get SEC Filing Alerts
10 Most Oversold S&P 500 Stocks
10 Most Overbought S&P 500 Stocks
10 ETFs With Stocks Insiders Are Buying
10 ETFs With Most Upside To Targets
The DividendRank Top 25
Warren Buffett Dividend Stocks
10 Cheap Dividend Stocks Under $10
10 Top DividendRank'ed Energy Stocks
The 10 Highest Yielding Preferred Stocks
The 15 Most Active S&P Call & Put Options

Next Earnings Date Calendar:

Guaranty Bancshares (GNTY): 10/18/2021 7:00 AM
State Street (STT): 10/18/2021 7:30 AM
Servisfirst Bancshares (SFBS): 10/18/2021 After close
FB Financial (FBK): 10/18/2021 After close
Xcel Brands (XELB): 10/18/2021 After close
CrossFirst Bankshares (CFB): 10/18/2021 After close
Zions Bancorp (ZION): 10/18/2021 After close
Hexcel (HXL): 10/18/2021 After close
Equity Lifestyle Props (ELS): 10/18/2021 After close
Steel Dynamics (STLD): 10/18/2021 After close

More from the Next Earnings Dates Calendar

Earnings History:

Charles Schwab (SCHW): 10/15/2021 8:45 AM
Badger Meter (BMI): 10/15/2021 8:30 AM
Goldman Sachs Group (GS): 10/15/2021 8:30 AM
Prologis (PLD): 10/15/2021 8:05 AM
JB Hunt Transport Servs (JBHT): 10/15/2021 7:00 AM
Sensient Technologies (SXT): 10/15/2021 6:55 AM
PNC Financial Services Gr (PNC): 10/15/2021 6:45 AM
Biomerica (BMRA): 10/15/2021 6:30 AM
Rocky Mountain Chocolate (RMCF): 10/15/2021 6:15 AM
Unity Bancorp (UNTY): 10/15/2021 6:00 AM

More from the Earnings History archive
W R Grace (GRA) is categorized under the Materials sector; to help you further research past earnings across stocks, below are some other companies in the same sector:

GT Past Earnings
HAYN Past Earnings
HBP Past Earnings
HCC Past Earnings
HL Past Earnings
HNRG Past Earnings
HUN Past Earnings
HWKN Past Earnings
HWM Past Earnings
HXL Past Earnings
On this page we presented the GRA earnings surprises information for W R Grace, comparing the expected earnings versus the actual earnings quarter by quarter, with the resulting positive or negative percentage surprise. Any self directed investor doing their due diligence on GRA (or any other given stock) can benefit from researching all of the W R Grace past earnings going backwards in time, including how often the company beat or missed the market's expectations. To help you with this W R Grace earnings surprise research, on this page we presented each quarter's resulting numbers for easy comparison. Studying these numbers can help an investor by providing important context with which to think about GRA's next earnings report. In your continued research on W R Grace we hope you will be sure to check out the further links included for revenue and earnings history as well as next earnings dates for GRA. Thanks for visiting, and the next time you need to research GRA earnings surprises or those of another stock, we hope you'll think of our site as your go-to earnings surprises research resource of choice.
 

W R Grace Earnings Surprises | www.NextEarningsDate.com | Copyright © 2020 - 2021, All Rights Reserved

Nothing in NextEarningsDate.com is intended to be investment advice, nor does it represent the opinion of, counsel from, or recommendations by BNK Invest Inc. or any of its affiliates, subsidiaries or partners. None of the information contained herein constitutes a recommendation that any particular security, portfolio, transaction, or investment strategy is suitable for any specific person. All viewers agree that under no circumstances will BNK Invest, Inc,. its subsidiaries, partners, officers, employees, affiliates, or agents be held liable for any loss or damage caused by your reliance on information obtained. By visiting, using or viewing this site, you agree to the following Full Disclaimer & Terms of Use and Privacy Policy. Video widget and market videos powered by Market News Video. Quote and option data delayed at least 15 minutes; stock quote data powered by Ticker Technologies, and Mergent.