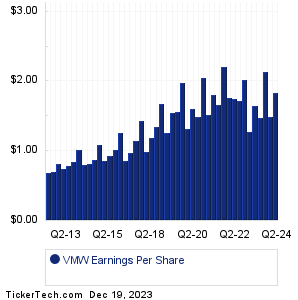
| VMW Earnings History | ||||||||||||||||||||||||||||||||||||||||||||||||||||||||||||||||||||||||||||||||||||||||||||||||||||||||||||||||||||||||||||||||||||||||||
|
|
|
| VMW Earnings History | ||||||||||||||||||||||||||||||||||||||||||||||||||||||||||||||||||||||||||||||||||||||||||||||||||||||||||||||||||||||||||||||||||||||||||
|
|
|
| VMW Revenue History | ||||||||||||||||||||||||||||||||||||||||||||||||||||||||||||||||||||||||||||||||||||||||||||||||||||||||||||||||||||||||||||||||||||||||||

|
| VMW Current Stock Quote |
Get Dividend Alerts Get SEC Filing Alerts |
| VMW Stock Price Chart |
| Next Earnings Dates |
Next Earnings Date Calendar:Embecta (EMBC): 12/19/2023 6:00 AMAccenture (ACN): 12/19/2023 6:45 AM FactSet Research Systems (FDS): 12/19/2023 7:00 AM FuelCell Energy (FCEL): 12/19/2023 7:30 AM FedEx (FDX): 12/19/2023 After close Steelcase (SCS): 12/19/2023 After close Worthington Industries (WOR): 12/19/2023 After close Know Labs (KNW): 12/19/2023 After close Enerpac Tool Group (EPAC): 12/19/2023 6:10 PM General Mills (GIS): 12/20/2023 7:00 AM More from the Next Earnings Dates Calendar Earnings History:Conn's (CONN): 12/18/2023 5:15 PMGEE Group (JOB): 12/18/2023 After close Ark Restaurants (ARKR): 12/18/2023 After close Inspirato (ISPO): 12/18/2023 After close Energy Servs of America (ESOA): 12/18/2023 9:00 AM Ennis (EBF): 12/18/2023 6:00 AM Heico (HEI): 12/18/2023 Before open Heico (HEI): 12/18/2023 Before open Barnwell Industries (BRN): 12/15/2023 6:05 PM PharmaCyte Biotech (PMCB): 12/15/2023 5:00 PM More from the Earnings History archive |
| Featured Articles |
| Earnings Peers |
| VMware (VMW) is categorized under the Technology sector; to help you further research past earnings across stocks, below are some other companies in the same sector:
VNT Past Earnings VPG Past Earnings VRAR Past Earnings VRME Past Earnings VRNS Past Earnings VRNT Past Earnings VRRM Past Earnings VRSN Past Earnings VSAT Past Earnings VTSI Past Earnings |
Recommended: WPI Videos, Funds Holding CLCO, Top Ten Hedge Funds Holding Q.
Click the button below for your complimentary copy of Your Early Retirement Portfolio: Dividends Up to 9.5%—Every Month—Forever.
You'll discover the details on 4 stocks and funds that pay you massive dividends as high as 9.5%.