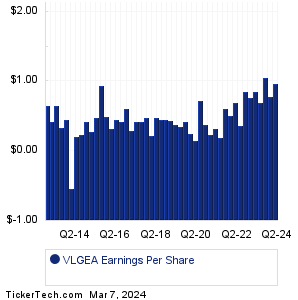
| VLGEA Earnings History | ||||||||||||||||||||||||||||||||||||||||||||||||||||||||||||||||||||||||||||||||||||||||||||||||||||||||||||||||||||||||||||||||||||||||||||||||
|
|
|
| VLGEA Earnings History | ||||||||||||||||||||||||||||||||||||||||||||||||||||||||||||||||||||||||||||||||||||||||||||||||||||||||||||||||||||||||||||||||||||||||||||||||
|
|
|
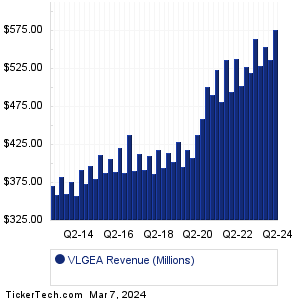
| VLGEA Revenue History | ||||||||||||||||||||||||||||||||||||||||||||||||||||||||||||||||||||||||||||||||||||||||||||||||||||||||||||||||||||||||||||||||||||||||||||||||
|
| VLGEA Current Stock Quote |
Get Dividend Alerts Get SEC Filing Alerts |
| VLGEA Stock Price Chart |
| Next Earnings Dates |
Next Earnings Date Calendar:Duluth Holdings (DLTH): 3/7/2024 5:45 AMSuperior Drilling Prods (SDPI): 3/7/2024 6:30 AM Arhaus (ARHS): 3/7/2024 6:30 AM Burlington Stores (BURL): 3/7/2024 6:45 AM BJ's Wholesale Club (BJ): 3/7/2024 6:45 AM Ciena (CIEN): 3/7/2024 7:00 AM CPI Card (PMTS): 3/7/2024 7:00 AM Alimera Sciences (ALIM): 3/7/2024 7:00 AM Summit Therapeutics (SMMT): 3/7/2024 7:00 AM Harvard Bioscience (HBIO): 3/7/2024 7:00 AM More from the Next Earnings Dates Calendar Earnings History:Global Water Resources (GWRS): 3/6/2024 9:00 PMDallasNews (DALN): 3/6/2024 5:25 PM CPS Technologies (CPSH): 3/6/2024 5:15 PM Stabilis Solutions (SLNG): 3/6/2024 5:05 PM Riley Exploration Permian (REPX): 3/6/2024 5:00 PM Viemed Healthcare (VMD): 3/6/2024 5:00 PM Miller Industries (MLR): 3/6/2024 After close Ellington Residential (EARN): 3/6/2024 After close NACCO Industries (NC): 3/6/2024 After close IDT (IDT): 3/6/2024 After close More from the Earnings History archive |
| Featured Articles |
| Earnings Peers |
Recommended: GT Historical Stock Prices, Funds Holding ICNB, SBGI Videos.
Click the button below for your complimentary copy of Your Early Retirement Portfolio: Dividends Up to 9.5%—Every Month—Forever.
You'll discover the details on 4 stocks and funds that pay you massive dividends as high as 9.5%.