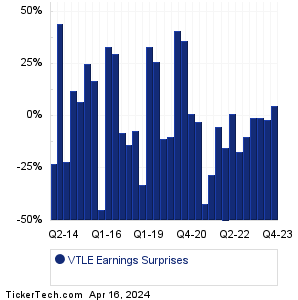
| Vital Energy Earnings Surprises | ||||||||||||||||||||||||||||||||||||||||||||||||||||||||||||||||||||||||||||||||||||||||||||||||||||||||||||||||||||||||||||||||||||||||
|
|
|
| Vital Energy Earnings Surprises | ||||||||||||||||||||||||||||||||||||||||||||||||||||||||||||||||||||||||||||||||||||||||||||||||||||||||||||||||||||||||||||||||||||||||
|
|
|
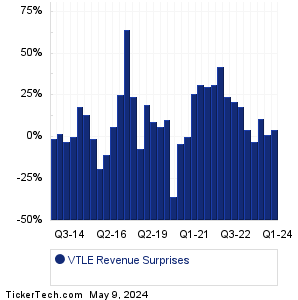
| VTLE Revenue Surprises | ||||||||||||||||||||||||||||||||||||||||||||||||||||||||||||||||||||||||||||||||||||||||||||||||||||||||||||||||||||||||||||||||||||||||
|
| VTLE Current Stock Quote |
Get Dividend Alerts Get SEC Filing Alerts |
| VTLE Stock Price Chart |
| Next Earnings Dates |
Next Earnings Date Calendar:Linde (LIN): 5/2/2024 6:00 AMCigna Group (CI): 5/2/2024 6:00 AM Targa Resources (TRGP): 5/2/2024 6:00 AM Ares Management (ARES): 5/2/2024 6:00 AM Stanley Black & Decker (SWK): 5/2/2024 6:00 AM Lamar Advertising (LAMR): 5/2/2024 6:00 AM WESCO Intl (WCC): 5/2/2024 6:00 AM Dentsply Sirona (XRAY): 5/2/2024 6:00 AM Murphy Oil (MUR): 5/2/2024 6:00 AM ExlService Holdings (EXLS): 5/2/2024 6:00 AM More from the Next Earnings Dates Calendar Earnings History:Materion (MTRN): 5/1/2024 6:23 PMPatterson-UTI Energy (PTEN): 5/1/2024 6:00 PM CPS Technologies (CPSH): 5/1/2024 5:15 PM Eversource Energy (ES): 5/1/2024 5:10 PM Hudson Pacific Properties (HPP): 5/1/2024 5:00 PM Vector Group (VGR): 5/1/2024 5:00 PM Cactus (WHD): 5/1/2024 5:00 PM RGC Resources (RGCO): 5/1/2024 5:00 PM Via Renewables (VIA): 5/1/2024 5:00 PM American Finl Gr (AFG): 5/1/2024 5:00 PM More from the Earnings History archive |
| Earnings Peers |
| Vital Energy (VTLE) is categorized under the Energy sector; to help you further research past earnings across stocks, below are some other companies in the same sector:
VTNR Historical Earnings VTOL Historical Earnings VTS Historical Earnings WHD Historical Earnings WKC Historical Earnings WLL Historical Earnings WMB Historical Earnings WTI Historical Earnings WTTR Historical Earnings XEC Historical Earnings |
Click the button below for your complimentary copy of Your Early Retirement Portfolio: Dividends Up to 8.7%—Every Month—Forever.
You'll discover the details on 4 stocks and funds that pay you massive dividends as high as 8.7%.