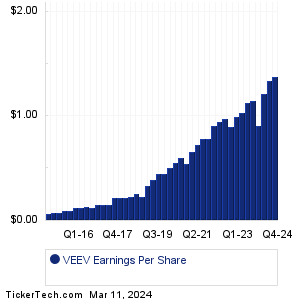
| Veeva Sys Earnings History | |||||||||||||||||||||||||||||||||||||||||||||||||||||||||||||||||||||||||||||||||||||||||||||||||||||||||||||||||||||||||||
|
|
|
| Veeva Sys Earnings History | |||||||||||||||||||||||||||||||||||||||||||||||||||||||||||||||||||||||||||||||||||||||||||||||||||||||||||||||||||||||||||
|
|
|
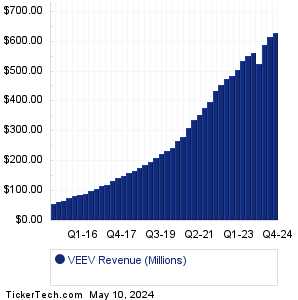
| VEEV Revenue History | |||||||||||||||||||||||||||||||||||||||||||||||||||||||||||||||||||||||||||||||||||||||||||||||||||||||||||||||||||||||||||
|
| VEEV Current Stock Quote |
Get Dividend Alerts Get SEC Filing Alerts |
| VEEV Stock Price Chart |
| Next Earnings Dates |
Next Earnings Date Calendar:ProKidney (PROK): 9/1/2023 5:00 AMSyneos Health (SYNH): 9/1/2023 6:00 AM National Healthcare (NHC): 9/1/2023 6:00 AM Scilex Holding (SCLX): 9/1/2023 7:00 AM Aldeyra Therapeutics (ALDX): 9/1/2023 7:00 AM EQRx (EQRX): 9/1/2023 8:00 AM AquaBounty Techs (AQB): 9/1/2023 8:00 AM Pardes Biosciences (PRDS): 9/1/2023 9:00 AM Terreno Realty (TRNO): 9/1/2023 After close Chinook Therapeutics (KDNY): 9/1/2023 After close More from the Next Earnings Dates Calendar Earnings History:Kewaunee Scientific (KEQU): 8/31/2023 5:34 PMIF Bancorp (IROQ): 8/31/2023 After close Quanex Building Prods (NX): 8/31/2023 After close PagerDuty (PD): 8/31/2023 After close Broadcom (AVGO): 8/31/2023 After close SentinelOne (S): 8/31/2023 After close Samsara (IOT): 8/31/2023 After close ClearSign Technologies (CLIR): 8/31/2023 After close Tilly's (TLYS): 8/31/2023 After close A-Mark Precious Metals (AMRK): 8/31/2023 After close More from the Earnings History archive |
| Featured Articles |
| Earnings Peers |
| Veeva Sys (VEEV) is categorized under the Technology sector; to help you further research past earnings across stocks, below are some other companies in the same sector:
VERB Past Earnings VERI Past Earnings VERX Past Earnings VG Past Earnings VIAV Past Earnings VIEW Past Earnings VISL Past Earnings VLDR Past Earnings VMEO Past Earnings VMW Past Earnings |
Recommended: Funds Holding THG, Funds Holding KAR, PEBO Dividend Growth Rate.
Click the button below for your complimentary copy of Your Early Retirement Portfolio: Dividends Up to 7.8%—Every Month—Forever.
You'll discover the details on 4 stocks and funds that pay you massive dividends as high as 7.8%.