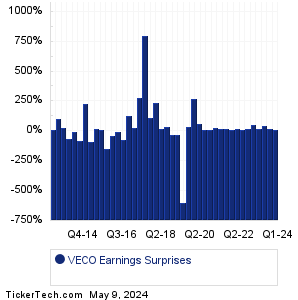
| Veeco Instruments Earnings Surprises | ||||||||||||||||||||||||||||||||||||||||||||||||||||||||||||||||||||||||||||||||||||||||||||||||||||||||||||||||||||||||||||||||||||||||||||||||||||||||||||||||||||||||
|
|
|
| Veeco Instruments Earnings Surprises | ||||||||||||||||||||||||||||||||||||||||||||||||||||||||||||||||||||||||||||||||||||||||||||||||||||||||||||||||||||||||||||||||||||||||||||||||||||||||||||||||||||||||
|
|
|
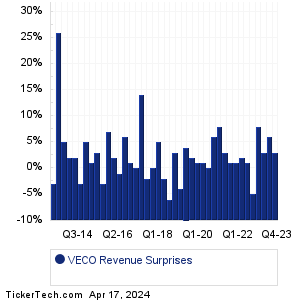
| VECO Revenue Surprises | ||||||||||||||||||||||||||||||||||||||||||||||||||||||||||||||||||||||||||||||||||||||||||||||||||||||||||||||||||||||||||||||||||||||||||||||||||||||||||||||||||||||||
|
| VECO Current Stock Quote |
Get Dividend Alerts Get SEC Filing Alerts |
| VECO Stock Price Chart |
| Next Earnings Dates |
Next Earnings Date Calendar:Citizens Financial Group (CFG): 4/17/2024 6:20 AMU.S. Bancorp (USB): 4/17/2024 6:45 AM First Horizon (FHN): 4/17/2024 6:45 AM BankUnited (BKU): 4/17/2024 6:45 AM Travelers Companies (TRV): 4/17/2024 6:57 AM Abbott Laboratories (ABT): 4/17/2024 7:30 AM Prologis (PLD): 4/17/2024 8:00 AM First Community (FCCO): 4/17/2024 9:00 AM Wintrust Finl (WTFC): 4/17/2024 After close Banner (BANR): 4/17/2024 After close More from the Next Earnings Dates Calendar Earnings History:XWELL (XWEL): 4/16/2024 5:30 PMEquity Bancshares (EQBK): 4/16/2024 5:10 PM ENGlobal (ENG): 4/16/2024 5:00 PM Immix Biopharma (IMMX): 4/16/2024 5:00 PM 1895 Bancorp of Wisconsin (BCOW): 4/16/2024 5:00 PM Hepion Pharmaceuticals (HEPA): 4/16/2024 After close Xcel Brands (XELB): 4/16/2024 After close Fulton Financial (FULT): 4/16/2024 After close Bank First (BFC): 4/16/2024 After close CXApp (CXAI): 4/16/2024 After close More from the Earnings History archive |
| Earnings Peers |
| Veeco Instruments (VECO) is categorized under the Technology sector; to help you further research past earnings across stocks, below are some other companies in the same sector:
VEEV Historical Earnings VERB Historical Earnings VERI Historical Earnings VERX Historical Earnings VG Historical Earnings VIAV Historical Earnings VIEW Historical Earnings VISL Historical Earnings VLDR Historical Earnings VMEO Historical Earnings |
Recommended: MTGE market cap history, DSOC Videos, GANX market cap history.
Click the button below for your complimentary copy of Your Early Retirement Portfolio: Dividends Up to 8.7%—Every Month—Forever.
You'll discover the details on 4 stocks and funds that pay you massive dividends as high as 8.7%.