| VEC Earnings Surprises | ||||||||||||||||||||||||||||||||||||||||||||||||||||||||||||||||||||||||||||||||||||||||||||||||||||||||||||||||||||||||
|
|
|
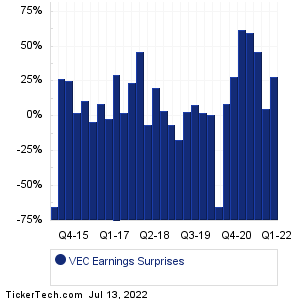
| VEC Earnings Surprises | ||||||||||||||||||||||||||||||||||||||||||||||||||||||||||||||||||||||||||||||||||||||||||||||||||||||||||||||||||||||||
|
|
|
| VEC Revenue Surprises | ||||||||||||||||||||||||||||||||||||||||||||||||||||||||||||||||||||||||||||||||||||||||||||||||||||||||||||||||||||||||

|
| VEC Current Stock Quote |
Get Dividend Alerts Get SEC Filing Alerts |
| VEC Stock Price Chart |
| Next Earnings Dates |
Next Earnings Date Calendar:Delta Air Lines (DAL): 7/13/2022 6:30 AMFastenal (FAST): 7/13/2022 7:00 AM Faraday Future (FFIE): 7/13/2022 7:45 AM Cinedigm (CIDM): 7/13/2022 After close Frequency Electronics (FEIM): 7/13/2022 After close Rocky Mountain Chocolate (RMCF): 7/13/2022 After close Ocean Power Technologies (OPTT): 7/13/2022 After close JPMorgan Chase (JPM): 7/14/2022 6:45 AM First Republic Bank (FRC): 7/14/2022 7:00 AM Morgan Stanley (MS): 7/14/2022 7:30 AM More from the Next Earnings Dates Calendar Earnings History:AngioDynamics (ANGO): 7/12/2022 7:00 AMPepsiCo (PEP): 7/12/2022 6:00 AM Pure Cycle (PCYO): 7/11/2022 5:00 PM Chase (CCF): 7/11/2022 5:00 PM E2open Parent Holdings (ETWO): 7/11/2022 After close Pricesmart (PSMT): 7/11/2022 After close Cryo-Cell International (CCEL): 7/11/2022 After close VOXX International (VOXX): 7/11/2022 After close AZZ (AZZ): 7/11/2022 6:19 AM Greenbrier Companies (GBX): 7/11/2022 6:00 AM More from the Earnings History archive |
| Earnings Peers |
| Vectrus (VEC) is categorized under the Technology sector; to help you further research past earnings across stocks, below are some other companies in the same sector:
VECO Past Earnings VEEV Past Earnings VERB Past Earnings VERI Past Earnings VERX Past Earnings VG Past Earnings VIAV Past Earnings VIEW Past Earnings VISL Past Earnings VMEO Past Earnings |
Recommended: Top Ten Hedge Funds Holding UTL, Funds Holding FSBW, CLDN Videos.