VCRA Earnings Surprises image   This VCRA earnings surprises page last updated 2/14/2022
VCRA Earnings Surprises Chart
Data adjusted for VCRA split history

PeriodExpectedActualSurprise
Q4 2021 0.19 0.29 +0.10 (+53%)
Q3 2021 0.15 0.28 +0.13 (+87%)
Q2 2021 0.09 0.15 +0.06 (+67%)
Q1 2021 -0.05 0.09 +0.14 (-280%)
Q4 2020 0.20 0.28 +0.08 (+40%)
Q3 2020 0.13 0.31 +0.18 (+138%)
Q2 2020 -0.05 0.10 +0.15 (-300%)
Q1 2020 -0.18 -0.14 +0.04 (-22%)
Q3 2019 0.19 0.23 +0.04 (+21%)
Q2 2019 -0.01 0.07 +0.08 (-800%)
Q1 2019 -0.23 -0.17 +0.06 (-26%)
Q3 2018 0.10 0.20 +0.10 (+100%)
Q2 2018 0.04 0.09 +0.05 (+125%)
Q1 2018 -0.05 0.04 +0.09 (-180%)
Q4 2017 0.14 0.29 +0.15 (+107%)
Q3 2017 0.10 0.11 +0.01 (+10%)
Q2 2017 -0.04 -0.03 +0.01 (-25%)
Q1 2017 -0.08 -0.05 +0.03 (-38%)
Q3 2016 0.02 0.08 +0.06 (+300%)
Q2 2016 -0.02 0.02 +0.04 (-200%)
Q1 2016 -0.05 -0.03 +0.02 (-40%)
Q4 2015 0.05 -0.01 -0.06 (-120%)
Q3 2015 -0.09 -0.04 +0.05 (-56%)
Q2 2015 -0.10 -0.09 +0.01 (-10%)
Q1 2015 -0.12 -0.07 +0.05 (-42%)
Q3 2014 -0.19 -0.16 +0.03 (-16%)
Q2 2014 -0.11 -0.16 -0.05 (+45%)
Q1 2014 -0.15 -0.26 -0.11 (+73%)
Q4 2013 0.02 0.03 +0.01 (+50%)
Q2 2013 -0.15 0.01 +0.16 (-107%)
Q1 2013 -0.02 -0.07 -0.05 (+250%)
Q4 2012 0.07 0.10 +0.03 (+43%)
Q3 2012 0.05 0.13 +0.08 (+160%)
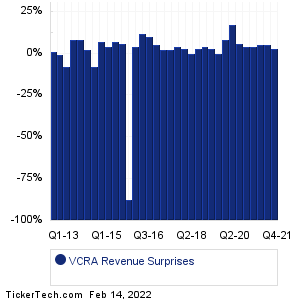
VCRA Revenue Surprises Chart
PeriodExpectedActualSurprise
Q4 2021 63.99M 65.77M +1.78M (+3%)
Q3 2021 60.49M 63.57M +3.08M (+5%)
Q2 2021 53.59M 56.18M +2.59M (+5%)
Q1 2021 46.78M 48.67M +1.89M (+4%)
Q4 2020 54.59M 56.59M +2.00M (+4%)
Q3 2020 50.55M 53.81M +3.27M (+6%)
Q2 2020 40.42M 47.35M +6.93M (+17%)
Q1 2020 37.53M 40.67M +3.14M (+8%)
Q3 2019 50.72M 50.78M +61000 (0%)
Q2 2019 43.54M 44.76M +1.22M (+3%)
Q1 2019 34.03M 35.31M +1.28M (+4%)
Q3 2018 46.54M 47.82M +1.28M (+3%)
Q2 2018 42.51M 42.69M +176000 (0%)
Q1 2018 39.15M 40.24M +1.09M (+3%)
Q4 2017 43.69M 45.50M +1.81M (+4%)
Q3 2017 41.44M 42.30M +860000 (+2%)
Q2 2017 37.54M 38.45M +910000 (+2%)
Q1 2017 34.45M 36.30M +1.84M (+5%)
Q3 2016 30.71M 33.76M +3.04M (+10%)
Q2 2016 27.90M 31.15M +3.25M (+12%)
Q1 2016 25.89M 26.80M +910000 (+4%)
Q4 2015 229.12M 28.36M -0.20B (-88%)
Q3 2015 24.96M 26.45M +1.49M (+6%)
Q2 2015 23.72M 25.40M +1.68M (+7%)
Q1 2015 22.79M 23.80M +1.01M (+4%)
Q3 2014 21.66M 23.10M +1.44M (+7%)
Q2 2014 24.93M 23.00M -1.93M (-8%)
Q1 2014 24.19M 24.70M +510000 (+2%)
Q4 2013 26.53M 28.70M +2.17M (+8%)
Q2 2013 23.39M 25.30M +1.91M (+8%)
Q1 2013 24.33M 22.40M -1.93M (-8%)
Q4 2012 27.35M 27.00M -0.35M (-1%)
Q3 2012 25.82M 26.00M +180000 (+1%)
Quotes delayed 20 minutes

Email EnvelopeFree VCRA Email Alerts:
Get Dividend Alerts
Get SEC Filing Alerts
10 Most Oversold S&P 500 Stocks
10 Most Overbought S&P 500 Stocks
10 ETFs With Stocks Insiders Are Buying
10 ETFs With Most Upside To Targets
The DividendRank Top 25
Warren Buffett Dividend Stocks
10 Cheap Dividend Stocks Under $10
10 Top DividendRank'ed Energy Stocks
The 10 Highest Yielding Preferred Stocks
The 15 Most Active S&P Call & Put Options

Next Earnings Date Calendar:

Hawaiian Electric Indus (HE): 2/14/2022 6:00 AM
Privia Health Group (PRVA): 2/14/2022 6:19 AM
Red Cat Holdings (RCAT): 2/14/2022 6:20 AM
Kelly Services (KELYA): 2/14/2022 7:00 AM
Applied Genetic Tech (AGTC): 2/14/2022 7:00 AM
Alexander's (ALX): 2/14/2022 8:00 AM
Weber (WEBR): 2/14/2022 8:00 AM
Westwater Resources (WWR): 2/14/2022 8:00 AM
Roivant Sciences (ROIV): 2/14/2022 8:00 AM
Treehouse Foods (THS): 2/14/2022 8:15 AM

More from the Next Earnings Dates Calendar

Earnings History:

Sonoma Pharmaceuticals (SNOA): 2/11/2022 After close
Xcel Brands (XELB): 2/11/2022 After close
ALJ Regional Holdings (ALJJ): 2/11/2022 After close
Gencor Industries (GENC): 2/11/2022 After close
Citizens & Northern (CZNC): 2/11/2022 After close
Kintara Therapeutics (KTRA): 2/11/2022 8:15 AM
Astrotech (ASTC): 2/11/2022 8:00 AM
Radius Global Infr (RADI): 2/11/2022 8:00 AM
Sylvamo (SLVM): 2/11/2022 8:00 AM
American Axle & Mfg Hldgs (AXL): 2/11/2022 8:00 AM

More from the Earnings History archive
Vocera Communications (VCRA) is categorized under the Technology sector; to help you further research past earnings across stocks, below are some other companies in the same sector:

VEC Past Earnings
VECO Past Earnings
VEEV Past Earnings
VERB Past Earnings
VERI Past Earnings
VERX Past Earnings
VG Past Earnings
VIAV Past Earnings
VIEW Past Earnings
VINC Past Earnings
On this page we presented the VCRA earnings surprises information for Vocera Communications, comparing the expected earnings versus the actual earnings quarter by quarter, with the resulting positive or negative percentage surprise. Any self directed investor doing their due diligence on VCRA (or any other given stock) can benefit from researching all of the Vocera Communications past earnings going backwards in time, including how often the company beat or missed the market's expectations. To help you with this Vocera Communications earnings surprise research, on this page we presented each quarter's resulting numbers for easy comparison. Studying these numbers can help an investor by providing important context with which to think about VCRA's next earnings report. In your continued research on Vocera Communications we hope you will be sure to check out the further links included for revenue and earnings history as well as next earnings dates for VCRA. Thanks for visiting, and the next time you need to research VCRA earnings surprises or those of another stock, we hope you'll think of our site as your go-to earnings surprises research resource of choice.

Recommended: Top Ten Hedge Funds Holding NLS, Top Ten Hedge Funds Holding WPXP, Top Ten Hedge Funds Holding RWED.


VCRA Earnings Surprises | www.NextEarningsDate.com | Copyright © 2020 - 2022, All Rights Reserved

Nothing in NextEarningsDate.com is intended to be investment advice, nor does it represent the opinion of, counsel from, or recommendations by BNK Invest Inc. or any of its affiliates, subsidiaries or partners. None of the information contained herein constitutes a recommendation that any particular security, portfolio, transaction, or investment strategy is suitable for any specific person. All viewers agree that under no circumstances will BNK Invest, Inc,. its subsidiaries, partners, officers, employees, affiliates, or agents be held liable for any loss or damage caused by your reliance on information obtained. By visiting, using or viewing this site, you agree to the following Full Disclaimer & Terms of Use and Privacy Policy. Video widget and market videos powered by Market News Video. Quote and option data delayed at least 15 minutes; stock quote data powered by Ticker Technologies, and Mergent.