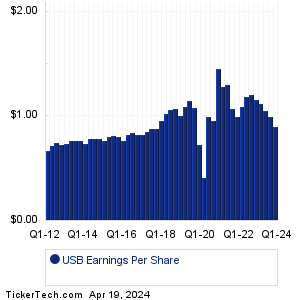
| U.S. Bancorp Earnings History | ||||||||||||||||||||||||||||||||||||||||||||||||||||||||||||||||||||||||||||||||||||||||||||||||||||||||||||||||||||||||||||||||||||||||||||||||
|
|
|
| U.S. Bancorp Earnings History | ||||||||||||||||||||||||||||||||||||||||||||||||||||||||||||||||||||||||||||||||||||||||||||||||||||||||||||||||||||||||||||||||||||||||||||||||
|
|
|
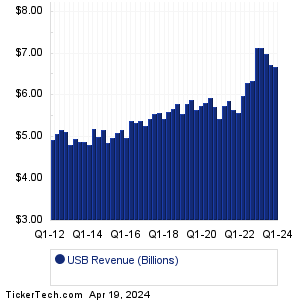
| USB Revenue History | ||||||||||||||||||||||||||||||||||||||||||||||||||||||||||||||||||||||||||||||||||||||||||||||||||||||||||||||||||||||||||||||||||||||||||||||||
|
| USB Current Stock Quote |
Get Dividend Alerts Get SEC Filing Alerts |
| USB Stock Price Chart |
| Next Earnings Dates |
Next Earnings Date Calendar:Crane NXT (CXT): 10/20/2023 5:36 AMRegions Finl (RF): 10/20/2023 6:00 AM Comerica (CMA): 10/20/2023 6:00 AM Sensient Technologies (SXT): 10/20/2023 6:55 AM SLB (SLB): 10/20/2023 7:00 AM American Express (AXP): 10/20/2023 7:00 AM Huntington Bancshares (HBAN): 10/20/2023 7:00 AM Interpublic Gr of Cos (IPG): 10/20/2023 7:00 AM First BanCorp (FBP): 10/20/2023 7:00 AM OFG Bancorp (OFG): 10/20/2023 7:30 AM More from the Next Earnings Dates Calendar Earnings History:Oak Valley (OVLY): 10/19/2023 7:42 PMHMN Finl (HMNF): 10/19/2023 7:00 PM Investar Holding (ISTR): 10/19/2023 5:30 PM Amerant Bancorp (AMTB): 10/19/2023 5:00 PM BayCom (BCML): 10/19/2023 After close Hilltop Hldgs (HTH): 10/19/2023 After close Glacier Bancorp (GBCI): 10/19/2023 After close Western Alliance (WAL): 10/19/2023 After close First Western Financial (MYFW): 10/19/2023 After close Metropolitan Bank Holding (MCB): 10/19/2023 After close More from the Earnings History archive |
| Featured Articles |
| Earnings Peers |
| U.S. Bancorp (USB) is categorized under the Financials sector; to help you further research past earnings across stocks, below are some other companies in the same sector:
USCB Past Earnings USIO Past Earnings UVE Past Earnings UVSP Past Earnings UWMC Past Earnings VABK Past Earnings VBFC Past Earnings VBTX Past Earnings VCTR Past Earnings VEL Past Earnings |
Recommended: Realtyome YTD Return, ADVC Videos, IMMY Options Chain.
Click the button below for your complimentary copy of Your Early Retirement Portfolio: Dividends Up to 8.1%—Every Month—Forever.
You'll discover the details on 4 stocks and funds that pay you massive dividends as high as 8.1%.