| Umpqua Holdings Earnings Surprises | ||||||||||||||||||||||||||||||||||||||||||||||||||||||||||||||||||||||||||||||||||||||||||||||||||||||||||||||||||||||||||||||||||||||||||||||||||||

|
|
|
| Umpqua Holdings Earnings Surprises | ||||||||||||||||||||||||||||||||||||||||||||||||||||||||||||||||||||||||||||||||||||||||||||||||||||||||||||||||||||||||||||||||||||||||||||||||||||
|
|
|
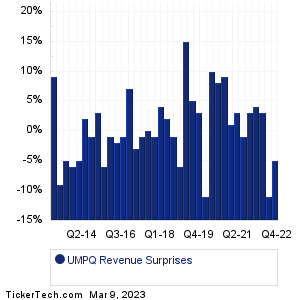
| UMPQ Revenue Surprises | ||||||||||||||||||||||||||||||||||||||||||||||||||||||||||||||||||||||||||||||||||||||||||||||||||||||||||||||||||||||||||||||||||||||||||||||||||||
|
| UMPQ Current Stock Quote |
Get Dividend Alerts Get SEC Filing Alerts |
| UMPQ Stock Price Chart |
| Next Earnings Dates |
Next Earnings Date Calendar:22nd Century Group (XXII): 3/9/2023 6:00 AMTownsquare Media (TSQ): 3/9/2023 6:00 AM Horizon Global (HZN): 3/9/2023 6:00 AM Arhaus (ARHS): 3/9/2023 6:30 AM Angel Oak Mortgage (AOMR): 3/9/2023 6:30 AM BJ's Wholesale Club (BJ): 3/9/2023 6:45 AM Build-A-Bear Workshop (BBW): 3/9/2023 6:45 AM Duluth Holdings (DLTH): 3/9/2023 6:45 AM Genesco (GCO): 3/9/2023 6:50 AM ANI Pharmaceuticals (ANIP): 3/9/2023 6:50 AM More from the Next Earnings Dates Calendar Earnings History:Global Water Resources (GWRS): 3/8/2023 8:42 PMBristow Group (VTOL): 3/8/2023 8:36 PM Miller Industries (MLR): 3/8/2023 6:49 PM Energy Fuels (UUUU): 3/8/2023 6:06 PM Stabilis Solutions (SLNG): 3/8/2023 5:40 PM NI Holdings (NODK): 3/8/2023 5:34 PM Advanced Emissions Solns (ADES): 3/8/2023 5:09 PM Earthstone Energy (ESTE): 3/8/2023 5:05 PM Kewaunee Scientific (KEQU): 3/8/2023 5:00 PM BG Staffing (BGSF): 3/8/2023 After close More from the Earnings History archive |
| Earnings Peers |
| Umpqua Holdings (UMPQ) is categorized under the Financials sector; to help you further research past earnings across stocks, below are some other companies in the same sector:
UNAM Historical Earnings UNB Historical Earnings UNH Historical Earnings UNIT Historical Earnings UNM Historical Earnings UNTY Historical Earnings USB Historical Earnings USCB Historical Earnings USIO Historical Earnings UVE Historical Earnings |
Recommended: Funds Holding TZO, IBM market cap history, MYHI Insider Buying.