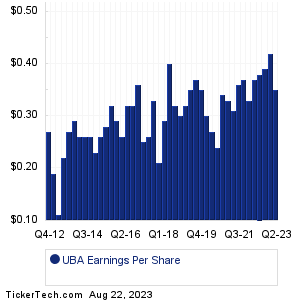
| UBA Earnings History | |||||||||||||||||||||||||||||||||||||||||||||||||||||||||||||||||||||||||||||||||||||||||||||||||||||||||||||||||||||||||||||||||||||||
|
|
|
| UBA Earnings History | |||||||||||||||||||||||||||||||||||||||||||||||||||||||||||||||||||||||||||||||||||||||||||||||||||||||||||||||||||||||||||||||||||||||
|
|
|
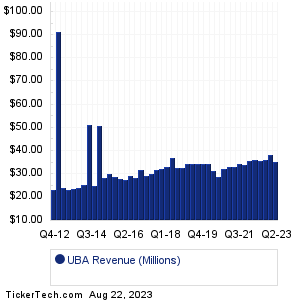
| UBA Revenue History | |||||||||||||||||||||||||||||||||||||||||||||||||||||||||||||||||||||||||||||||||||||||||||||||||||||||||||||||||||||||||||||||||||||||
|
| UBA Current Stock Quote |
Get Dividend Alerts Get SEC Filing Alerts |
| UBA Stock Price Chart |
| Next Earnings Dates |
Next Earnings Date Calendar:Lowe's Companies (LOW): 8/22/2023 6:00 AMCoty (COTY): 8/22/2023 6:30 AM Premier (PINC): 8/22/2023 6:30 AM Medtronic (MDT): 8/22/2023 6:45 AM BJ's Wholesale Club (BJ): 8/22/2023 6:45 AM Citi Trends (CTRN): 8/22/2023 6:45 AM Macy's (M): 8/22/2023 6:55 AM Dick's Sporting Goods (DKS): 8/22/2023 7:00 AM Garmin (GRMN): 8/22/2023 7:01 AM Sphere Entertainment (SPHR): 8/22/2023 7:30 AM More from the Next Earnings Dates Calendar Earnings History:Battalion Oil (BATL): 8/21/2023 After closeOcugen (OCGN): 8/21/2023 After close Nordson (NDSN): 8/21/2023 After close Fabrinet (FN): 8/21/2023 After close Dragonfly Energy Hldgs (DFLI): 8/21/2023 After close Flexsteel Industries (FLXS): 8/21/2023 After close Faraday Future (FFIE): 8/21/2023 After close Zoom Video Comms (ZM): 8/21/2023 After close Sagimet Biosciences (SGMT): 8/21/2023 After close OLB Gr (OLB): 8/21/2023 9:40 AM More from the Earnings History archive |
| Featured Articles |
| Earnings Peers |
| Urstadt Biddle Properties (UBA) is categorized under the Financials sector; to help you further research past earnings across stocks, below are some other companies in the same sector:
UBFO Past Earnings UBOH Past Earnings UBSI Past Earnings UCBI Past Earnings UDR Past Earnings UE Past Earnings UFCS Past Earnings UHT Past Earnings UIHC Past Earnings UMBF Past Earnings |
Click the button below for your complimentary copy of Your Early Retirement Portfolio: Dividends Up to 7.8%—Every Month—Forever.
You'll discover the details on 4 stocks and funds that pay you massive dividends as high as 7.8%.