| Twitter Earnings Surprises | ||||||||||||||||||||||||||||||||||||||||||||||||||||||||||||||||||||||||||||||||||||||||||||||||||||||||||||||||||||||||||||||||||||
|
|
|
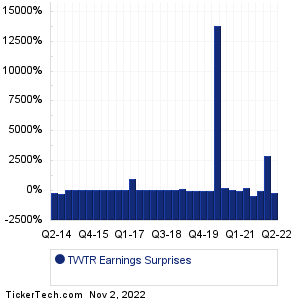
| Twitter Earnings Surprises | ||||||||||||||||||||||||||||||||||||||||||||||||||||||||||||||||||||||||||||||||||||||||||||||||||||||||||||||||||||||||||||||||||||
|
|
|
| TWTR Revenue Surprises | ||||||||||||||||||||||||||||||||||||||||||||||||||||||||||||||||||||||||||||||||||||||||||||||||||||||||||||||||||||||||||||||||||||

|
| TWTR Current Stock Quote |
Get Dividend Alerts Get SEC Filing Alerts |
| TWTR Stock Price Chart |
| Next Earnings Dates |
Next Earnings Date Calendar:Avient (AVNT): 11/2/2022 1:00 AMTE Connectivity (TEL): 11/2/2022 6:00 AM Martin Marietta Materials (MLM): 11/2/2022 6:00 AM Entegris (ENTG): 11/2/2022 6:00 AM Generac Hldgs (GNRC): 11/2/2022 6:00 AM United Therapeutics (UTHR): 11/2/2022 6:00 AM SiteOne Landscape Supply (SITE): 11/2/2022 6:00 AM DISH Network (DISH): 11/2/2022 6:00 AM ACI Worldwide (ACIW): 11/2/2022 6:00 AM Enovis (ENOV): 11/2/2022 6:00 AM More from the Next Earnings Dates Calendar Earnings History:Enhabit (EHAB): 11/1/2022 5:40 PMViewRay (VRAY): 11/1/2022 5:18 PM Mayville Engineering (MEC): 11/1/2022 5:00 PM Randolph Bancorp (RNDB): 11/1/2022 5:00 PM Hyster-Yale Materials (HY): 11/1/2022 5:00 PM National Research (NRC): 11/1/2022 5:00 PM Littelfuse (LFUS): 11/1/2022 5:00 PM Community Healthcare (CHCT): 11/1/2022 After close Markel (MKL): 11/1/2022 After close Vector Group (VGR): 11/1/2022 After close More from the Earnings History archive |
| Earnings Peers |
| Twitter (TWTR) is categorized under the Technology sector; to help you further research past earnings across stocks, below are some other companies in the same sector:
TXN Historical Earnings TYL Historical Earnings TZOO Historical Earnings U Historical Earnings UBER Historical Earnings UCTT Historical Earnings UI Historical Earnings UIS Historical Earnings UPLD Historical Earnings UPWK Historical Earnings |