| TRACON Pharma Earnings History | |||||||||||||||||||||||||||||||||||||||||||||||||||||||||||||||||||||||||||||||||||||||||||||||||||||||||

|
|
|
| TRACON Pharma Earnings History | |||||||||||||||||||||||||||||||||||||||||||||||||||||||||||||||||||||||||||||||||||||||||||||||||||||||||
|
|
|
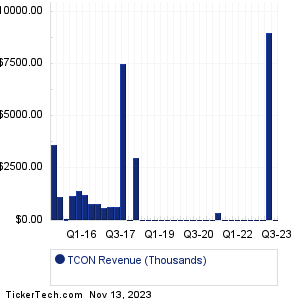
| TCON Revenue History | |||||||||||||||||||||||||||||||||||||||||||||||||||||||||||||||||||||||||||||||||||||||||||||||||||||||||
|
| TCON Current Stock Quote |
Get Dividend Alerts Get SEC Filing Alerts |
| TCON Stock Price Chart |
| Next Earnings Dates |
Next Earnings Date Calendar:AirSculpt Technologies (AIRS): 5/12/2023 6:00 AMAmerican Strategic (NYC): 5/12/2023 6:00 AM Spectrum Brands Holdings (SPB): 5/12/2023 6:30 AM Embecta (EMBC): 5/12/2023 6:30 AM Humacyte (HUMA): 5/12/2023 7:00 AM LifeMD (LFMD): 5/12/2023 7:00 AM Augmedix (AUGX): 5/12/2023 7:00 AM Bio-Path Holdings (BPTH): 5/12/2023 7:00 AM Biofrontera (BFRI): 5/12/2023 7:00 AM Delcath Systems (DCTH): 5/12/2023 7:30 AM More from the Next Earnings Dates Calendar Earnings History:Kineta (KA): 5/11/2023 5:20 PMKoss (KOSS): 5/11/2023 5:15 PM Intrusion (INTZ): 5/11/2023 5:00 PM Third Harmonic Bio (THRD): 5/11/2023 5:00 PM Maui Land & Pineapple Co (MLP): 5/11/2023 5:00 PM Faraday Future (FFIE): 5/11/2023 5:00 PM Nuvve Holding (NVVE): 5/11/2023 After close Lument Finance Trust (LFT): 5/11/2023 After close Geospace Technologies (GEOS): 5/11/2023 After close 8x8 (EGHT): 5/11/2023 After close More from the Earnings History archive |
| Featured Articles |
| Earnings Peers |
| TRACON Pharma (TCON) is categorized under the Healthcare sector; to help you further research past earnings across stocks, below are some other companies in the same sector:
TCRR Past Earnings TCRT Past Earnings TCRX Past Earnings TDOC Past Earnings TECH Past Earnings TELA Past Earnings TENX Past Earnings TERN Past Earnings TFFP Past Earnings TFX Past Earnings |
Recommended: Funds Holding BFAC, Funds Holding HR, AU Videos.
Click the button below for your complimentary copy of Your Early Retirement Portfolio: Dividends Up to 7.8%—Every Month—Forever.
You'll discover the details on 4 stocks and funds that pay you massive dividends as high as 7.8%.