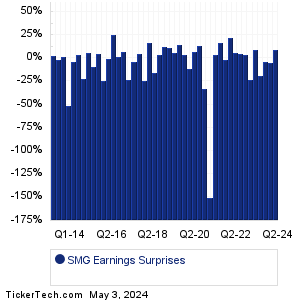
| Scotts Miracle Gro Earnings Surprises | ||||||||||||||||||||||||||||||||||||||||||||||||||||||||||||||||||||||||||||||||||||||||||||||||||||||||||||||||||||||||||||||||||||||||||||||||||||||||||||||||||||||||
|
|
|
| Scotts Miracle Gro Earnings Surprises | ||||||||||||||||||||||||||||||||||||||||||||||||||||||||||||||||||||||||||||||||||||||||||||||||||||||||||||||||||||||||||||||||||||||||||||||||||||||||||||||||||||||||
|
|
|
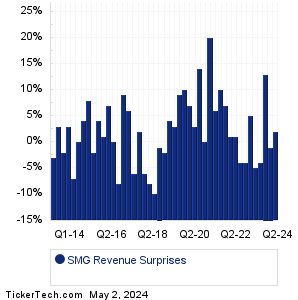
| SMG Revenue Surprises | ||||||||||||||||||||||||||||||||||||||||||||||||||||||||||||||||||||||||||||||||||||||||||||||||||||||||||||||||||||||||||||||||||||||||||||||||||||||||||||||||||||||||
|
| SMG Current Stock Quote |
Get Dividend Alerts Get SEC Filing Alerts |
| SMG Stock Price Chart |
| Next Earnings Dates |
Next Earnings Date Calendar:Interface (TILE): 5/5/2023 5:30 AMCigna Group (CI): 5/5/2023 6:00 AM EPAM Sys (EPAM): 5/5/2023 6:00 AM Evergy (EVRG): 5/5/2023 6:00 AM Huntsman (HUN): 5/5/2023 6:00 AM Proto Labs (PRLB): 5/5/2023 6:00 AM Gray Television (GTN): 5/5/2023 6:00 AM Johnson Outdoors (JOUT): 5/5/2023 6:00 AM City Office REIT (CIO): 5/5/2023 6:00 AM Amneal Pharmaceuticals (AMRX): 5/5/2023 6:00 AM More from the Next Earnings Dates Calendar Earnings History:Alliant Energy (LNT): 5/4/2023 6:00 PMMettler-Toledo Intl (MTD): 5/4/2023 5:15 PM AES (AES): 5/4/2023 5:13 PM Merrimack Pharmaceuticals (MACK): 5/4/2023 5:00 PM Forum Energy Technologies (FET): 5/4/2023 5:00 PM Post Hldgs (POST): 5/4/2023 5:00 PM Consolidated Edison (ED): 5/4/2023 After close Western Asset Mortgage (WMC): 5/4/2023 After close MasTec (MTZ): 5/4/2023 After close Axcella Health (AXLA): 5/4/2023 After close More from the Earnings History archive |
| Earnings Peers |
| Scotts Miracle Gro (SMG) is categorized under the Materials sector; to help you further research past earnings across stocks, below are some other companies in the same sector:
SMID Historical Earnings SND Historical Earnings SON Historical Earnings SSD Historical Earnings STLD Historical Earnings SUM Historical Earnings SWIM Historical Earnings SWM Historical Earnings SXC Historical Earnings SXT Historical Earnings |