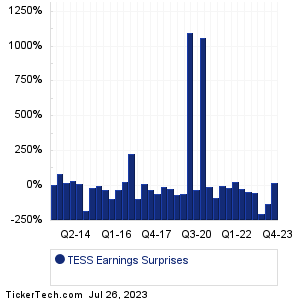
| TESS Earnings Surprises | ||||||||||||||||||||||||||||||||||||||||||||||||||||||||||||||||||||||||||||||||||||||||||||||||||||||||||||||||||||||||||||||||||||||||||||||||
|
|
|
| TESS Earnings Surprises | ||||||||||||||||||||||||||||||||||||||||||||||||||||||||||||||||||||||||||||||||||||||||||||||||||||||||||||||||||||||||||||||||||||||||||||||||
|
|
|
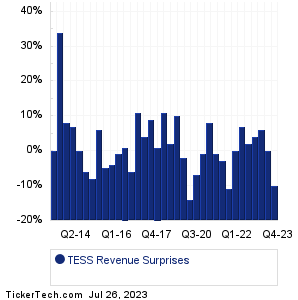
| TESS Revenue Surprises | ||||||||||||||||||||||||||||||||||||||||||||||||||||||||||||||||||||||||||||||||||||||||||||||||||||||||||||||||||||||||||||||||||||||||||||||||
|
| TESS Current Stock Quote |
Get Dividend Alerts Get SEC Filing Alerts |
| TESS Stock Price Chart |
| Next Earnings Dates |
Next Earnings Date Calendar:Lithia Motors (LAD): 7/26/2023 5:00 AMAllegion (ALLE): 7/26/2023 5:30 AM Thermo Fisher Scientific (TMO): 7/26/2023 6:00 AM TE Connectivity (TEL): 7/26/2023 6:00 AM Hilton Worldwide Holdings (HLT): 7/26/2023 6:00 AM Owens-Corning (OC): 7/26/2023 6:00 AM Provident Finl Hldgs (PROV): 7/26/2023 6:00 AM Otis Worldwide (OTIS): 7/26/2023 6:11 AM Taylor Morrison Home (TMHC): 7/26/2023 6:15 AM Group 1 Automotive (GPI): 7/26/2023 6:27 AM More from the Next Earnings Dates Calendar Earnings History:Timberland Bancorp (TSBK): 7/25/2023 7:00 PMPacWest Banc (PACW): 7/25/2023 5:53 PM Flushing Financial (FFIC): 7/25/2023 5:20 PM Ashland (ASH): 7/25/2023 5:12 PM Encore Wire (WIRE): 7/25/2023 5:05 PM Waste Management (WM): 7/25/2023 5:04 PM Veritex Holdings (VBTX): 7/25/2023 5:00 PM First Busey (BUSE): 7/25/2023 5:00 PM First Commonwealth (FCF): 7/25/2023 5:00 PM Enterprise Bancorp (EBTC): 7/25/2023 After close More from the Earnings History archive |
| Earnings Peers |
| Tessco Technologies (TESS) is categorized under the Technology sector; to help you further research past earnings across stocks, below are some other companies in the same sector:
TGAN Historical Earnings TLS Historical Earnings TMUS Historical Earnings TOST Historical Earnings TRHC Historical Earnings TRIP Historical Earnings TRMB Historical Earnings TRNS Historical Earnings TSP Historical Earnings TSRI Historical Earnings |
Click the button below for your complimentary copy of Your Early Retirement Portfolio: Dividends Up to 7.8%—Every Month—Forever.
You'll discover the details on 4 stocks and funds that pay you massive dividends as high as 7.8%.