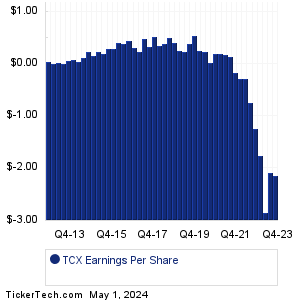
| TCX Earnings History | |||||||||||||||||||||||||||||||||||||||||||||||||||||||||||||||||||||||||||||||||||||||||||||||||||||||||||||||||||||||||||||||||||||||||||||
|
|
|
| TCX Earnings History | |||||||||||||||||||||||||||||||||||||||||||||||||||||||||||||||||||||||||||||||||||||||||||||||||||||||||||||||||||||||||||||||||||||||||||||
|
|
|
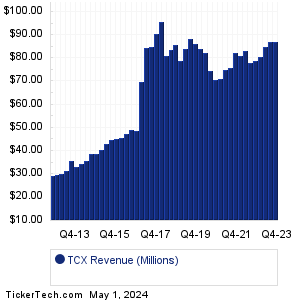
| TCX Revenue History | |||||||||||||||||||||||||||||||||||||||||||||||||||||||||||||||||||||||||||||||||||||||||||||||||||||||||||||||||||||||||||||||||||||||||||||
|
| TCX Current Stock Quote |
Get Dividend Alerts Get SEC Filing Alerts |
| TCX Stock Price Chart |
| Next Earnings Dates |
Next Earnings Date Calendar:Domino's Pizza (DPZ): 2/26/2024 6:00 AMClear Channel Outdoor (CCO): 2/26/2024 6:00 AM Fresh Del Monte Produce (FDP): 2/26/2024 6:15 AM Elanco Animal Health (ELAN): 2/26/2024 6:30 AM Freshpet (FRPT): 2/26/2024 6:30 AM Sphere Entertainment (SPHR): 2/26/2024 6:51 AM Fidelity National Info (FIS): 2/26/2024 7:00 AM Krystal Biotech (KRYS): 2/26/2024 7:00 AM BioCryst Pharma (BCRX): 2/26/2024 7:00 AM Pilgrims Pride (PPC): 2/26/2024 7:00 AM More from the Next Earnings Dates Calendar Earnings History:NEXTracker (NXT): 2/25/2024 4:14 AMARCA biopharma (ABIO): 2/23/2024 After close Federal Agricultural (AGM): 2/23/2024 8:00 AM Sunstone Hotel Invts (SHO): 2/23/2024 7:30 AM E W Scripps (SSP): 2/23/2024 7:30 AM Ritchie Bros Auctioneers (RBA): 2/23/2024 7:30 AM Frontier Communications (FYBR): 2/23/2024 7:00 AM Warner Bros. Discovery (WBD): 2/23/2024 7:00 AM Hyatt Hotels (H): 2/23/2024 6:55 AM Gray Television (GTN): 2/23/2024 6:46 AM More from the Earnings History archive |
| Featured Articles |
| Earnings Peers |
| Tucows (TCX) is categorized under the Technology sector; to help you further research past earnings across stocks, below are some other companies in the same sector:
TDC Past Earnings TDS Past Earnings TDY Past Earnings TEAM Past Earnings TENB Past Earnings TER Past Earnings TESS Past Earnings TGAN Past Earnings TLS Past Earnings TMUS Past Earnings |
Click the button below for your complimentary copy of Your Early Retirement Portfolio: Dividends Up to 9.5%—Every Month—Forever.
You'll discover the details on 4 stocks and funds that pay you massive dividends as high as 9.5%.