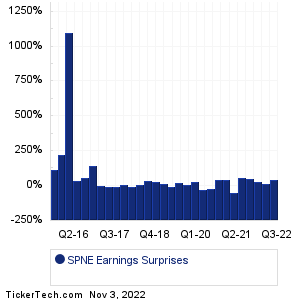
| SPNE Earnings Surprises | ||||||||||||||||||||||||||||||||||||||||||||||||||||||||||||||||||||||||||||||||||||||||||||||||||||||||||||||||||||||||
|
|
|
| SPNE Earnings Surprises | ||||||||||||||||||||||||||||||||||||||||||||||||||||||||||||||||||||||||||||||||||||||||||||||||||||||||||||||||||||||||
|
|
|
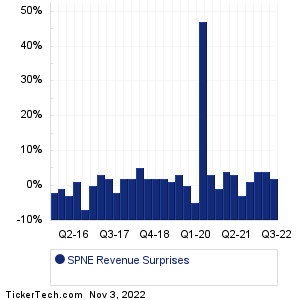
| SPNE Revenue Surprises | ||||||||||||||||||||||||||||||||||||||||||||||||||||||||||||||||||||||||||||||||||||||||||||||||||||||||||||||||||||||||
|
| SPNE Current Stock Quote |
Get Dividend Alerts Get SEC Filing Alerts |
| SPNE Stock Price Chart |
| Next Earnings Dates |
Next Earnings Date Calendar:Cigna (CI): 11/3/2022 6:00 AMAir Products & Chemicals (APD): 11/3/2022 6:00 AM EPAM Systems (EPAM): 11/3/2022 6:00 AM Targa Resources (TRGP): 11/3/2022 6:00 AM WESCO International (WCC): 11/3/2022 6:00 AM ITT (ITT): 11/3/2022 6:00 AM Murphy Oil (MUR): 11/3/2022 6:00 AM Ingredion (INGR): 11/3/2022 6:00 AM Hyatt Hotels (H): 11/3/2022 6:00 AM Vontier (VNT): 11/3/2022 6:00 AM More from the Next Earnings Dates Calendar Earnings History:BG Staffing (BGSF): 11/2/2022 6:23 PMArchrock (AROC): 11/2/2022 6:17 PM Stabilis Solutions (SLNG): 11/2/2022 5:30 PM Bristow Group (VTOL): 11/2/2022 5:30 PM Talos Energy (TALO): 11/2/2022 5:30 PM Seacor Marine Hldgs (SMHI): 11/2/2022 5:28 PM Innovative Industrial (IIPR): 11/2/2022 5:10 PM Sturm Ruger & Co (RGR): 11/2/2022 5:05 PM Via Renewables (VIA): 11/2/2022 5:00 PM NACCO Industries (NC): 11/2/2022 5:00 PM More from the Earnings History archive |
| Earnings Peers |
| SeaSpine Holdings (SPNE) is categorized under the Healthcare sector; to help you further research past earnings across stocks, below are some other companies in the same sector:
SPPI Historical Earnings SPRB Historical Earnings SPRO Historical Earnings SQL Historical Earnings SQZ Historical Earnings SRDX Historical Earnings SRGA Historical Earnings SRNE Historical Earnings SRPT Historical Earnings SRRA Historical Earnings |
Recommended: GUSH Historical Stock Prices, STBZ market cap history, AVGR Videos.