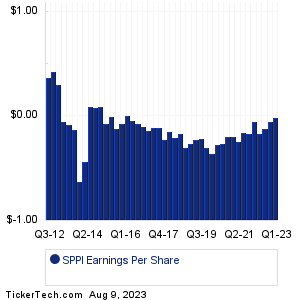
| Spectrum Pharmaceuticals Earnings History | |||||||||||||||||||||||||||||||||||||||||||||||||||||||||||||||||||||||||||||||||||||||||||||||||||||||||||||||||||||||||||||||||||||||
|
|
|
| Spectrum Pharmaceuticals Earnings History | |||||||||||||||||||||||||||||||||||||||||||||||||||||||||||||||||||||||||||||||||||||||||||||||||||||||||||||||||||||||||||||||||||||||
|
|
|
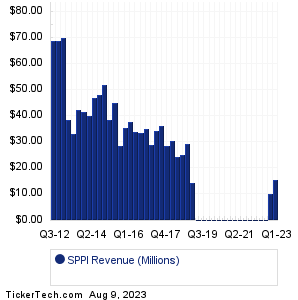
| SPPI Revenue History | |||||||||||||||||||||||||||||||||||||||||||||||||||||||||||||||||||||||||||||||||||||||||||||||||||||||||||||||||||||||||||||||||||||||
|
| SPPI Current Stock Quote |
Get Dividend Alerts Get SEC Filing Alerts |
| SPPI Stock Price Chart |
| Next Earnings Dates |
Next Earnings Date Calendar:GEO Group (GEO): 8/9/2023 6:00 AMFirst Advantage (FA): 8/9/2023 6:00 AM LifeStance Health Gr (LFST): 8/9/2023 6:00 AM Vertex Energy (VTNR): 8/9/2023 6:00 AM European Wax Center (EWCZ): 8/9/2023 6:00 AM LL Flooring Holdings (LL): 8/9/2023 6:00 AM Townsquare Media (TSQ): 8/9/2023 6:00 AM GoodRx Holdings (GDRX): 8/9/2023 6:02 AM Everi Hldgs (EVRI): 8/9/2023 6:15 AM OGE Energy (OGE): 8/9/2023 6:30 AM More from the Next Earnings Dates Calendar Earnings History:Atlanticus Holdings (ATLC): 8/8/2023 8:49 PMFlotek Industries (FTK): 8/8/2023 7:00 PM Talos Energy (TALO): 8/8/2023 7:00 PM Broadway Financial (BYFC): 8/8/2023 6:40 PM WeWork (WE): 8/8/2023 5:15 PM NI Holdings (NODK): 8/8/2023 5:10 PM US Physical Therapy (USPH): 8/8/2023 5:05 PM Tessco Technologies (TESS): 8/8/2023 5:00 PM Gladstone Commercial (GOOD): 8/8/2023 After close Darling Ingredients (DAR): 8/8/2023 After close More from the Earnings History archive |
| Featured Articles |
| Earnings Peers |
| Spectrum Pharmaceuticals (SPPI) is categorized under the Healthcare sector; to help you further research past earnings across stocks, below are some other companies in the same sector:
SPRB Past Earnings SPRO Past Earnings SPRY Past Earnings SQL Past Earnings SQZ Past Earnings SRDX Past Earnings SRGA Past Earnings SRNE Past Earnings SRPT Past Earnings SRRA Past Earnings |
Click the button below for your complimentary copy of Your Early Retirement Portfolio: Dividends Up to 7.8%—Every Month—Forever.
You'll discover the details on 4 stocks and funds that pay you massive dividends as high as 7.8%.