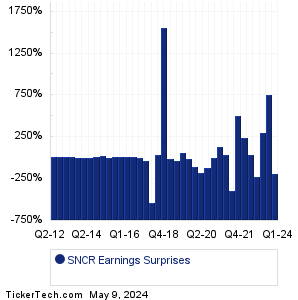
| SNCR Earnings Surprises | ||||||||||||||||||||||||||||||||||||||||||||||||||||||||||||||||||||||||||||||||||||||||||||||||||||||||||||||||||||||||||||||||||||||||||||||||||||
|
|
|
| SNCR Earnings Surprises | ||||||||||||||||||||||||||||||||||||||||||||||||||||||||||||||||||||||||||||||||||||||||||||||||||||||||||||||||||||||||||||||||||||||||||||||||||||
|
|
|
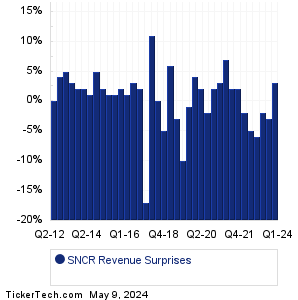
| SNCR Revenue Surprises | ||||||||||||||||||||||||||||||||||||||||||||||||||||||||||||||||||||||||||||||||||||||||||||||||||||||||||||||||||||||||||||||||||||||||||||||||||||
|
| SNCR Current Stock Quote |
Get Dividend Alerts Get SEC Filing Alerts |
| SNCR Stock Price Chart |
| Next Earnings Dates |
Next Earnings Date Calendar:PepsiCo (PEP): 4/23/2024 6:00 AMDanaher (DHR): 4/23/2024 6:00 AM United Parcel Service (UPS): 4/23/2024 6:00 AM LKQ (LKQ): 4/23/2024 6:00 AM Polaris (PII): 4/23/2024 6:00 AM Banc of California (BANC): 4/23/2024 6:00 AM Peoples Bancorp (PEBO): 4/23/2024 6:00 AM GE Aero (GE): 4/23/2024 6:22 AM General Motors (GM): 4/23/2024 6:30 AM PulteGroup (PHM): 4/23/2024 6:30 AM More from the Next Earnings Dates Calendar Earnings History:FlexShopper (FPAY): 4/22/2024 6:00 PMCidara Therapeutics (CDTX): 4/22/2024 5:10 PM Independent Bank Gr (IBTX): 4/22/2024 5:00 PM Washington Federal (WAFD): 4/22/2024 5:00 PM SmartFinancial (SMBK): 4/22/2024 5:00 PM Packaging Corp of America (PKG): 4/22/2024 5:00 PM Brown & Brown (BRO): 4/22/2024 5:00 PM Pinnacle Finl Partners (PNFP): 4/22/2024 After close BV Financial (BVFL): 4/22/2024 After close Cathay General (CATY): 4/22/2024 After close More from the Earnings History archive |
| Earnings Peers |
| Synchronoss Technologies (SNCR) is categorized under the Technology sector; to help you further research past earnings across stocks, below are some other companies in the same sector:
SNOW Historical Earnings SNPS Historical Earnings SNX Historical Earnings SONM Historical Earnings SOTK Historical Earnings SPLK Historical Earnings SPOK Historical Earnings SPRT Historical Earnings SPSC Historical Earnings SPT Historical Earnings |
Click the button below for your complimentary copy of Your Early Retirement Portfolio: Dividends Up to 8.7%—Every Month—Forever.
You'll discover the details on 4 stocks and funds that pay you massive dividends as high as 8.7%.