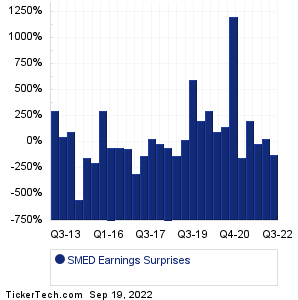
| SMED Earnings Surprises | ||||||||||||||||||||||||||||||||||||||||||||||||||||||||||||||||||||||||||||||||||||||||||||||||||||||||||||||||||||
|
|
|
| SMED Earnings Surprises | ||||||||||||||||||||||||||||||||||||||||||||||||||||||||||||||||||||||||||||||||||||||||||||||||||||||||||||||||||||
|
|
|
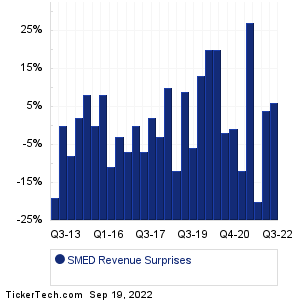
| SMED Revenue Surprises | ||||||||||||||||||||||||||||||||||||||||||||||||||||||||||||||||||||||||||||||||||||||||||||||||||||||||||||||||||||
|
| SMED Current Stock Quote |
Get Dividend Alerts Get SEC Filing Alerts |
| SMED Stock Price Chart |
| Next Earnings Dates |
Next Earnings Date Calendar:AutoZone (AZO): 9/19/2022 6:55 AMRa Medical Systems (RMED): 9/19/2022 After close Apogee Enterprises (APOG): 9/20/2022 6:00 AM Lixte Biotech Holdings (LIXT): 9/20/2022 6:00 AM Stitch Fix (SFIX): 9/20/2022 After close General Mills (GIS): 9/21/2022 7:00 AM H.B. Fuller (FUL): 9/21/2022 After close Steelcase (SCS): 9/21/2022 After close KB Home (KBH): 9/21/2022 After close Lennar (LEN): 9/21/2022 After close More from the Next Earnings Dates Calendar Earnings History:Sonendo (SONX): 9/18/2022 After closeJackson Financial (JXN): 9/16/2022 8:00 AM Claros Mortgage Trust (CMTG): 9/16/2022 4:02 AM Rezolute (RZLT): 9/15/2022 After close Bowlero (BOWL): 9/15/2022 After close Adobe (ADBE): 9/15/2022 8:00 AM Document Security Systems (DSS): 9/14/2022 5:33 PM CFSB Bancorp (CFSB): 9/14/2022 5:00 PM PharmaCyte Biotech (PMCB): 9/14/2022 After close Coffee Holding Co (JVA): 9/14/2022 After close More from the Earnings History archive |
| Earnings Peers |
| Sharps Compliance (SMED) is categorized under the Industrials sector; to help you further research past earnings across stocks, below are some other companies in the same sector:
SMHI Historical Earnings SNA Historical Earnings SNCY Historical Earnings SNDR Historical Earnings SOI Historical Earnings SPCE Historical Earnings SPR Historical Earnings SPXC Historical Earnings SRCL Historical Earnings SREV Historical Earnings |
Recommended: SWAG YTD Return, ALTS shares outstanding history, YUM Split History.