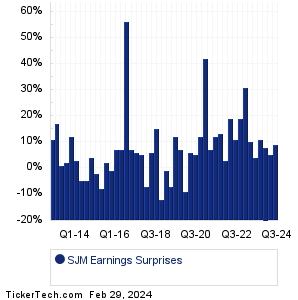
| SJM Earnings Surprises | ||||||||||||||||||||||||||||||||||||||||||||||||||||||||||||||||||||||||||||||||||||||||||||||||||||||||||||||||||||||||||||||||||||||||||||||||||||||||||||||||||||||||||||||||||||||||||||
|
|
|
| SJM Earnings Surprises | ||||||||||||||||||||||||||||||||||||||||||||||||||||||||||||||||||||||||||||||||||||||||||||||||||||||||||||||||||||||||||||||||||||||||||||||||||||||||||||||||||||||||||||||||||||||||||||
|
|
|
| SJM Revenue Surprises | ||||||||||||||||||||||||||||||||||||||||||||||||||||||||||||||||||||||||||||||||||||||||||||||||||||||||||||||||||||||||||||||||||||||||||||||||||||||||||||||||||||||||||||||||||||||||||||

|
| SJM Current Stock Quote |
Get Dividend Alerts Get SEC Filing Alerts |
| SJM Stock Price Chart |
| Next Earnings Dates |
Next Earnings Date Calendar:Bath & Body Works (BBWI): 2/29/2024 6:00 AMDentsply Sirona (XRAY): 2/29/2024 6:00 AM ExlService Holdings (EXLS): 2/29/2024 6:00 AM MultiPlan (MPLN): 2/29/2024 6:00 AM Landsea Homes (LSEA): 2/29/2024 6:00 AM Manitex International (MNTX): 2/29/2024 6:00 AM New Fortress Energy (NFE): 2/29/2024 6:00 AM ACI Worldwide (ACIW): 2/29/2024 6:00 AM GMS (GMS): 2/29/2024 6:00 AM Six Flags Entertainment (SIX): 2/29/2024 6:00 AM More from the Next Earnings Dates Calendar Earnings History:Cactus (WHD): 2/28/2024 5:30 PMExcelerate Energy (EE): 2/28/2024 5:00 PM Via Renewables (VIA): 2/28/2024 5:00 PM CymaBay Therapeutics (CBAY): 2/28/2024 After close Stoneridge (SRI): 2/28/2024 After close Summit Hotel Properties (INN): 2/28/2024 After close UMH Properties (UMH): 2/28/2024 After close Accel Entertainment (ACEL): 2/28/2024 After close Kinetik Holdings (KNTK): 2/28/2024 After close AMC Enter Hldgs (AMC): 2/28/2024 After close More from the Earnings History archive |
| Earnings Peers |
| JM Smucker (SJM) is categorized under the Consumer sector; to help you further research past earnings across stocks, below are some other companies in the same sector:
SKX Historical Earnings SMP Historical Earnings SMPL Historical Earnings SNAX Historical Earnings SNPO Historical Earnings SONO Historical Earnings SOVO Historical Earnings SPB Historical Earnings SQBG Historical Earnings SRI Historical Earnings |
Click the button below for your complimentary copy of Your Early Retirement Portfolio: Dividends Up to 9.5%—Every Month—Forever.
You'll discover the details on 4 stocks and funds that pay you massive dividends as high as 9.5%.