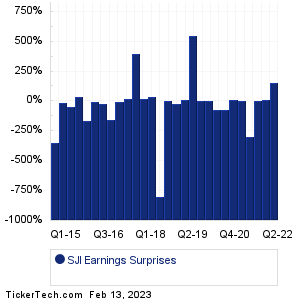
| SJI Earnings Surprises | ||||||||||||||||||||||||||||||||||||||||||||||||||||||||||||||||||||||||||||||||||||||||||||||||||||||||||||||||||||
|
|
|
| SJI Earnings Surprises | ||||||||||||||||||||||||||||||||||||||||||||||||||||||||||||||||||||||||||||||||||||||||||||||||||||||||||||||||||||
|
|
|
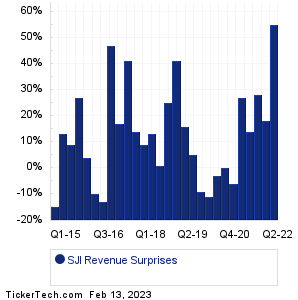
| SJI Revenue Surprises | ||||||||||||||||||||||||||||||||||||||||||||||||||||||||||||||||||||||||||||||||||||||||||||||||||||||||||||||||||||
|
| SJI Current Stock Quote |
Get Dividend Alerts Get SEC Filing Alerts |
| SJI Stock Price Chart |
| Next Earnings Dates |
Next Earnings Date Calendar:Treehouse Foods (THS): 2/13/2023 6:55 AMBlue Owl Capital Inc. Class A Common Stock (OWL): 2/13/2023 7:00 AM Jerash Holdings (US) (JRSH): 2/13/2023 7:00 AM Teradata (TDC): 2/13/2023 8:00 AM Alexander's (ALX): 2/13/2023 8:00 AM S&W Seed (SANW): 2/13/2023 8:00 AM Arch Capital Group (ACGL): 2/13/2023 After close Palantir Technologies (PLTR): 2/13/2023 After close Lattice Semiconductor (LSCC): 2/13/2023 After close Vornado Realty (VNO): 2/13/2023 After close More from the Next Earnings Dates Calendar Earnings History:Houston American Energy (HUSA): 2/12/2023 8:55 AMBarnwell Industries (BRN): 2/10/2023 6:00 PM Broadway Financial (BYFC): 2/10/2023 5:29 PM Affinity Bancshares (AFBI): 2/10/2023 After close Citius Pharmaceuticals (CTXR): 2/10/2023 After close Air T (AIRT): 2/10/2023 After close Rezolute (RZLT): 2/10/2023 After close BGC Partners (BGCP): 2/10/2023 8:00 AM W.P. Carey (WPC): 2/10/2023 7:30 AM Newell Brands (NWL): 2/10/2023 7:03 AM More from the Earnings History archive |
| Earnings Peers |
| South Jersey Indus (SJI) is categorized under the Utilities sector; to help you further research past earnings across stocks, below are some other companies in the same sector:
SJW Historical Earnings SLNG Historical Earnings SO Historical Earnings SPKE Historical Earnings SR Historical Earnings SRE Historical Earnings SWX Historical Earnings UGI Historical Earnings UTL Historical Earnings VIA Historical Earnings |
Recommended: SKIL Options Chain, PCG RSI, XPON Average Annual Return.