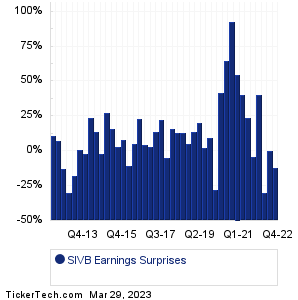
| SIVB Earnings Surprises | ||||||||||||||||||||||||||||||||||||||||||||||||||||||||||||||||||||||||||||||||||||||||||||||||||||||||||||||||||||||||||||||||||||||||||||||||||||||||||||||||||||||||||||
|
|
|
| SIVB Earnings Surprises | ||||||||||||||||||||||||||||||||||||||||||||||||||||||||||||||||||||||||||||||||||||||||||||||||||||||||||||||||||||||||||||||||||||||||||||||||||||||||||||||||||||||||||||
|
|
|
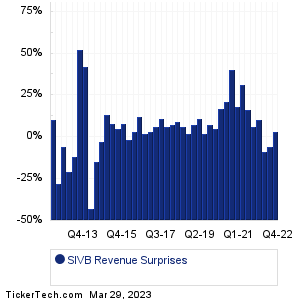
| SIVB Revenue Surprises | ||||||||||||||||||||||||||||||||||||||||||||||||||||||||||||||||||||||||||||||||||||||||||||||||||||||||||||||||||||||||||||||||||||||||||||||||||||||||||||||||||||||||||||
|
| SIVB Current Stock Quote |
Get Dividend Alerts Get SEC Filing Alerts |
| SIVB Stock Price Chart |
| Next Earnings Dates |
Next Earnings Date Calendar:Arhaus (ARHS): 3/29/2023 6:00 AMConn's (CONN): 3/29/2023 6:00 AM Sharecare (SHCR): 3/29/2023 7:00 AM bluebird bio (BLUE): 3/29/2023 7:00 AM GlycoMimetics (GLYC): 3/29/2023 7:00 AM RenovoRx (RNXT): 3/29/2023 7:00 AM UniFirst (UNF): 3/29/2023 8:00 AM Alaunos Therapeutics (TCRT): 3/29/2023 8:00 AM DecisionPoint Sys (DPSI): 3/29/2023 8:00 AM Local Bounti (LOCL): 3/29/2023 8:00 AM More from the Next Earnings Dates Calendar Earnings History:Presidio Property Trust (SQFT): 3/28/2023 6:01 PMGlobal Self Storage (SELF): 3/28/2023 5:20 PM vTv Therapeutics (VTVT): 3/28/2023 5:00 PM Willamette Valley (WVVI): 3/28/2023 5:00 PM Jefferies Financial Group (JEF): 3/28/2023 After close DiaMedica Therapeutics (DMAC): 3/28/2023 After close Redwire (RDW): 3/28/2023 After close Ekso Bionics Holdings (EKSO): 3/28/2023 After close HCW Biologics (HCWB): 3/28/2023 After close Biote (BTMD): 3/28/2023 After close More from the Earnings History archive |
| Earnings Peers |
| SVB Financial (SIVB) is categorized under the Financials sector; to help you further research past earnings across stocks, below are some other companies in the same sector:
SKT Historical Earnings SLCT Historical Earnings SLG Historical Earnings SLM Historical Earnings SLQT Historical Earnings SMBC Historical Earnings SMBK Historical Earnings SMMF Historical Earnings SNEX Historical Earnings SNR Historical Earnings |
Recommended: Top Ten Hedge Funds Holding MDYV, XMTR market cap history, SRS YTD Return.