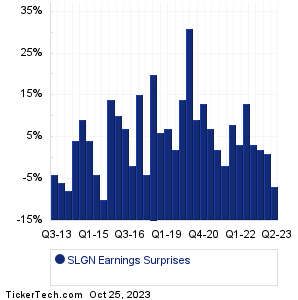
| Silgan Holdings Earnings Surprises | ||||||||||||||||||||||||||||||||||||||||||||||||||||||||||||||||||||||||||||||||||||||||||||||||||||||||||||||||||||||||||||||||||||
|
|
|
| Silgan Holdings Earnings Surprises | ||||||||||||||||||||||||||||||||||||||||||||||||||||||||||||||||||||||||||||||||||||||||||||||||||||||||||||||||||||||||||||||||||||
|
|
|
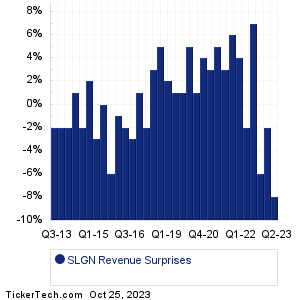
| SLGN Revenue Surprises | ||||||||||||||||||||||||||||||||||||||||||||||||||||||||||||||||||||||||||||||||||||||||||||||||||||||||||||||||||||||||||||||||||||
|
| SLGN Current Stock Quote |
Get Dividend Alerts Get SEC Filing Alerts |
| SLGN Stock Price Chart |
| Next Earnings Dates |
Next Earnings Date Calendar:Elevance Health (ELV): 10/18/2023 6:00 AMCommerce Bancshares (CBSH): 10/18/2023 6:00 AM M&T Bank (MTB): 10/18/2023 6:05 AM Citizens Financial Group (CFG): 10/18/2023 6:20 AM U.S. Bancorp (USB): 10/18/2023 6:45 AM First Horizon (FHN): 10/18/2023 6:45 AM Procter & Gamble (PG): 10/18/2023 6:55 AM Travelers Companies (TRV): 10/18/2023 6:57 AM Nasdaq (NDAQ): 10/18/2023 7:00 AM Winnebago Industries (WGO): 10/18/2023 7:00 AM More from the Next Earnings Dates Calendar Earnings History:Wintrust Finl (WTFC): 10/17/2023 5:00 PMEquity Bancshares (EQBK): 10/17/2023 After close Fulton Financial (FULT): 10/17/2023 After close Bar Harbor Bankshares (BHB): 10/17/2023 After close JB Hunt Transport Servs (JBHT): 10/17/2023 After close Omnicom Group (OMC): 10/17/2023 After close Preferred Bank (PFBC): 10/17/2023 After close Interactive Brokers Gr (IBKR): 10/17/2023 After close Hancock Whitney (HWC): 10/17/2023 After close Pinnacle Finl Partners (PNFP): 10/17/2023 After close More from the Earnings History archive |
| Earnings Peers |
| Silgan Holdings (SLGN) is categorized under the Materials sector; to help you further research past earnings across stocks, below are some other companies in the same sector:
SLVM Historical Earnings SMG Historical Earnings SMID Historical Earnings SND Historical Earnings SON Historical Earnings SSD Historical Earnings STLD Historical Earnings SUM Historical Earnings SWIM Historical Earnings SWM Historical Earnings |
Recommended: GDX Options Chain, FMN shares outstanding history, ISRG Technical Analysis.
Click the button below for your complimentary copy of Your Early Retirement Portfolio: Dividends Up to 8.1%—Every Month—Forever.
You'll discover the details on 4 stocks and funds that pay you massive dividends as high as 8.1%.