SGMS Earnings Surprises image   This SGMS earnings surprises page last updated 5/4/2022
SGMS Earnings Surprises Chart
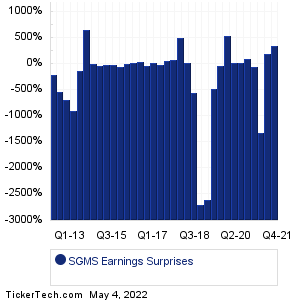
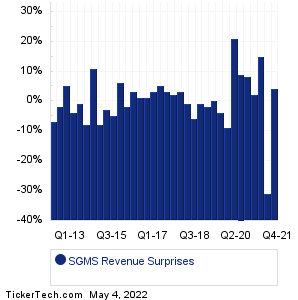
Data adjusted for SGMS split history

PeriodExpectedActualSurprise
Q4 2021 0.13 0.58 +0.45 (+346%)
Q3 2021 0.33 0.96 +0.63 (+191%)
Q2 2021 -0.09 1.10 +1.19 (-1322%)
Q1 2021 -0.45 -0.16 +0.29 (-64%)
Q4 2020 -0.47 -0.95 -0.48 (+102%)
Q3 2020 -0.79 -0.97 -0.18 (+23%)
Q2 2020 -1.70 -2.15 -0.45 (+26%)
Q1 2020 -0.11 -0.70 -0.59 (+536%)
Q4 2019 0.22 0.14 -0.08 (-36%)
Q3 2019 -0.04 0.15 +0.19 (-475%)
Q2 2019 0.01 -0.25 -0.26 (-2600%)
Q1 2019 0.01 -0.26 -0.27 (-2700%)
Q3 2018 0.10 -0.46 -0.56 (-560%)
Q2 2018 -0.05 -0.06 -0.01 (+20%)
Q1 2018 -0.28 -1.68 -1.40 (+500%)
Q4 2017 -0.27 -0.48 -0.21 (+78%)
Q3 2017 -0.43 -0.66 -0.23 (+53%)
Q2 2017 -0.52 -0.44 +0.08 (-15%)
Q1 2017 -0.72 -0.87 -0.15 (+21%)
Q4 2016 -0.89 -0.48 +0.41 (-46%)
Q3 2016 -0.84 -1.13 -0.29 (+35%)
Q2 2016 -0.79 -0.88 -0.09 (+11%)
Q1 2016 -0.97 -1.07 -0.10 (+10%)
Q4 2015 -1.20 -0.48 +0.72 (-60%)
Q3 2015 -1.08 -0.85 +0.23 (-21%)
Q2 2015 -0.98 -0.79 +0.19 (-19%)
Q1 2015 -1.26 -0.80 +0.46 (-37%)
Q4 2014 -0.60 -0.55 +0.05 (-8%)
Q1 2014 -0.07 -0.53 -0.46 (+657%)
Q3 2013 0.04 -0.01 -0.05 (-125%)
Q1 2013 0.02 -0.16 -0.18 (-900%)
Q4 2012 0.05 -0.29 -0.34 (-680%)
Q3 2012 0.07 -0.30 -0.37 (-529%)
Q2 2012 0.12 -0.14 -0.26 (-217%)
SGMS Revenue Surprises Chart
PeriodExpectedActualSurprise
Q4 2021 558.56M 580.00M +21.44M (+4%)
Q3 2021 778.02M 539.00M -0.24B (-31%)
Q2 2021 765.23M 880.00M +114.77M (+15%)
Q1 2021 715.72M 729.00M +13.28M (+2%)
Q4 2020 708.62M 762.00M +53.38M (+8%)
Q3 2020 641.47M 698.00M +56.53M (+9%)
Q2 2020 443.70M 539.00M +95.30M (+21%)
Q1 2020 792.58M 725.00M -67.58M (-9%)
Q4 2019 895.28M 863.00M -32.28M (-4%)
Q3 2019 851.14M 855.00M +3.86M (0%)
Q2 2019 859.86M 845.00M -14.86M (-2%)
Q1 2019 844.90M 837.00M -7.90M (-1%)
Q3 2018 875.31M 821.00M -54.31M (-6%)
Q2 2018 853.64M 844.70M -8.94M (-1%)
Q1 2018 790.46M 811.80M +21.34M (+3%)
Q4 2017 810.43M 823.00M +12.57M (+2%)
Q3 2017 746.78M 768.90M +22.12M (+3%)
Q2 2017 732.93M 766.30M +33.37M (+5%)
Q1 2017 706.47M 725.40M +18.93M (+3%)
Q4 2016 742.26M 752.20M +9.94M (+1%)
Q3 2016 709.40M 720.00M +10.60M (+1%)
Q2 2016 710.67M 729.20M +18.53M (+3%)
Q1 2016 693.88M 682.00M -11.88M (-2%)
Q4 2015 692.45M 737.00M +44.55M (+6%)
Q3 2015 704.88M 671.60M -33.28M (-5%)
Q2 2015 715.72M 691.50M -24.22M (-3%)
Q1 2015 715.10M 658.70M -56.40M (-8%)
Q4 2014 510.72M 565.80M +55.08M (+11%)
Q1 2014 421.02M 388.10M -32.92M (-8%)
Q3 2013 237.94M 234.40M -3.54M (-1%)
Q1 2013 227.59M 219.60M -7.99M (-4%)
Q4 2012 237.15M 249.20M +12.05M (+5%)
Q3 2012 233.16M 227.50M -5.66M (-2%)
Q2 2012 245.39M 229.30M -16.09M (-7%)
Quotes delayed 20 minutes

Email EnvelopeFree SGMS Email Alerts:
Get Dividend Alerts
Get SEC Filing Alerts
10 Most Oversold S&P 500 Stocks
10 Most Overbought S&P 500 Stocks
10 ETFs With Stocks Insiders Are Buying
10 ETFs With Most Upside To Targets
The DividendRank Top 25
Warren Buffett Dividend Stocks
10 Cheap Dividend Stocks Under $10
10 Top DividendRank'ed Energy Stocks
The 10 Highest Yielding Preferred Stocks
The 15 Most Active S&P Call & Put Options

Next Earnings Date Calendar:

Janus Henderson Gr (JHG): 5/4/2022 4:00 AM
Regeneron Pharmaceuticals (REGN): 5/4/2022 6:00 AM
Generac Hldgs (GNRC): 5/4/2022 6:00 AM
SiteOne Landscape Supply (SITE): 5/4/2022 6:00 AM
Murphy Oil (MUR): 5/4/2022 6:00 AM
Gentherm (THRM): 5/4/2022 6:00 AM
Northwest Natural Holding (NWN): 5/4/2022 6:00 AM
Fresh Del Monte Produce (FDP): 5/4/2022 6:00 AM
Amneal Pharmaceuticals (AMRX): 5/4/2022 6:00 AM
Lumber Liquidators Hldgs (LL): 5/4/2022 6:00 AM

More from the Next Earnings Dates Calendar

Earnings History:

TPG RE Finance Trust (TRTX): 5/3/2022 6:45 PM
Viemed Healthcare (VMD): 5/3/2022 5:30 PM
Gulfport Energy (GPOR): 5/3/2022 5:10 PM
Blackbaud (BLKB): 5/3/2022 5:10 PM
Conduent (CNDT): 5/3/2022 5:05 PM
Viant Technology (DSP): 5/3/2022 5:05 PM
Talkspace (TALK): 5/3/2022 5:05 PM
Pulmonx (LUNG): 5/3/2022 5:05 PM
Starbucks (SBUX): 5/3/2022 5:05 PM
GAMCO Investors (GBL): 5/3/2022 5:00 PM

More from the Earnings History archive
Scientific Games (SGMS) is categorized under the Services sector; to help you further research past earnings across stocks, below are some other companies in the same sector:

SHAK Past Earnings
SIC Past Earnings
SIG Past Earnings
SIRI Past Earnings
SITE Past Earnings
SIX Past Earnings
SKY Past Earnings
SNBR Past Earnings
SP Past Earnings
SPTN Past Earnings
On this page we presented the SGMS earnings surprises information for Scientific Games, comparing the expected earnings versus the actual earnings quarter by quarter, with the resulting positive or negative percentage surprise. Any self directed investor doing their due diligence on SGMS (or any other given stock) can benefit from researching all of the Scientific Games past earnings going backwards in time, including how often the company beat or missed the market's expectations. To help you with this Scientific Games earnings surprise research, on this page we presented each quarter's resulting numbers for easy comparison. Studying these numbers can help an investor by providing important context with which to think about SGMS's next earnings report. In your continued research on Scientific Games we hope you will be sure to check out the further links included for revenue and earnings history as well as next earnings dates for SGMS. Thanks for visiting, and the next time you need to research SGMS earnings surprises or those of another stock, we hope you'll think of our site as your go-to earnings surprises research resource of choice.

Recommended: CBB market cap history, AGG Videos, Top Ten Hedge Funds Holding OZON.


SGMS Earnings Surprises | www.NextEarningsDate.com | Copyright © 2020 - 2022, All Rights Reserved

Nothing in NextEarningsDate.com is intended to be investment advice, nor does it represent the opinion of, counsel from, or recommendations by BNK Invest Inc. or any of its affiliates, subsidiaries or partners. None of the information contained herein constitutes a recommendation that any particular security, portfolio, transaction, or investment strategy is suitable for any specific person. All viewers agree that under no circumstances will BNK Invest, Inc,. its subsidiaries, partners, officers, employees, affiliates, or agents be held liable for any loss or damage caused by your reliance on information obtained. By visiting, using or viewing this site, you agree to the following Full Disclaimer & Terms of Use and Privacy Policy. Video widget and market videos powered by Market News Video. Quote and option data delayed at least 15 minutes; stock quote data powered by Ticker Technologies, and Mergent.