SFL Earnings History image   This SFL earnings history page last updated 11/23/2021
SFL Earnings History Chart
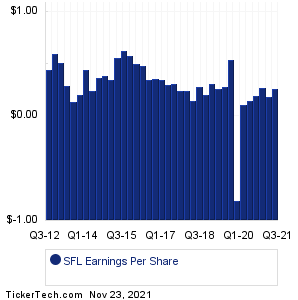
Data adjusted for SFL split history
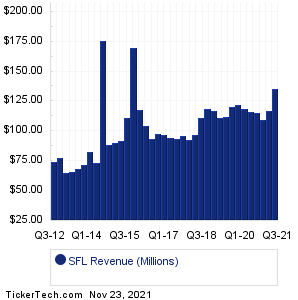
PeriodEarnings DateGAAP
Q3 202111/16/20210.260
Q2 20218/18/20210.180
Q1 20215/12/20210.270
Q4 20202/17/20210.190
Q3 202011/12/20200.150
Q2 20208/18/20200.110
Q1 20205/20/2020-0.810
Q4 20192/18/20200.540
Q3 201911/21/20190.280
Q2 20198/20/20190.260
Q1 20195/21/20190.310
Q4 20182/26/20190.2
Q3 201811/20/20180.28
Q2 20188/22/20180.15
Q1 20185/31/20180.24
Q4 20172/27/20180.24
Q3 201711/22/20170.31
Q2 20178/30/20170.3
Q1 20175/30/20170.35
Q4 20162/28/20170.36
Q3 201611/29/20160.35
Q2 20168/31/20160.48
Q1 20165/31/20160.5
Q4 20152/29/20160.58
Q3 201511/24/20150.63
Q2 20158/26/20150.56
Q1 20155/29/20150.35
Q4 20142/26/20150.39
Q3 201411/25/20140.37
Q2 20148/28/20140.24
Q1 20145/27/20140.44
Q4 20132/27/20140.2
Q3 201311/27/20130.14
Q2 20138/28/20130.29
Q1 20135/30/20130.51
Q4 20122/25/20130.6
Q3 201211/29/20120.44
SFL Revenue History Chart
PeriodEarnings DateGAAP
Q3 202111/16/20210.14B
Q2 20218/18/20210.12B
Q1 20215/12/20210.11B
Q4 20202/17/20210.11B
Q3 202011/12/20200.12B
Q2 20208/18/20200.12B
Q1 20205/20/20200.12B
Q4 20192/18/20200.12B
Q3 201911/21/20190.11B
Q2 20198/20/20190.11B
Q1 20195/21/20190.12B
Q4 20182/26/2019118.57M
Q3 201811/20/2018111.00M
Q2 20188/22/201896.80M
Q1 20185/31/201892.35M
Q4 20172/27/201896.10M
Q3 201711/22/201793.67M
Q2 20178/30/201794.22M
Q1 20175/30/201796.88M
Q4 20162/28/201797.85M
Q3 201611/29/201693.53M
Q2 20168/31/2016103.99M
Q1 20165/31/2016117.58M
Q4 20152/29/2016170.00M
Q3 201511/24/2015110.71M
Q2 20158/26/201592.00M
Q1 20155/29/201590.09M
Q4 20142/26/201588.66M
Q3 201411/25/2014176.00M
Q2 20148/28/201473.00M
Q1 20145/27/201482.67M
Q4 20132/27/201471.70M
Q3 201311/27/201368.08M
Q2 20138/28/201366.00M
Q1 20135/30/20130.07B
Q4 20122/25/201377.65M
Q3 201211/29/201274.30M
Quotes delayed 20 minutes

Email EnvelopeFree SFL Email Alerts:
Get Dividend Alerts
Get SEC Filing Alerts
10 Most Oversold S&P 500 Stocks
10 Most Overbought S&P 500 Stocks
10 ETFs With Stocks Insiders Are Buying
10 ETFs With Most Upside To Targets
The DividendRank Top 25
Warren Buffett Dividend Stocks
10 Cheap Dividend Stocks Under $10
10 Top DividendRank'ed Energy Stocks
The 10 Highest Yielding Preferred Stocks
The 15 Most Active S&P Call & Put Options

Next Earnings Date Calendar:

Dycom Industries (DY): 11/23/2021 6:00 AM
908 Devices (MASS): 11/23/2021 6:17 AM
American Woodmark (AMWD): 11/23/2021 6:30 AM
Medtronic (MDT): 11/23/2021 6:45 AM
Burlington Stores (BURL): 11/23/2021 6:45 AM
Movado Group (MOV): 11/23/2021 6:45 AM
Analog Devices (ADI): 11/23/2021 7:00 AM
Best Buy Co (BBY): 11/23/2021 7:00 AM
JM Smucker (SJM): 11/23/2021 7:00 AM
Titan Machinery (TITN): 11/23/2021 7:00 AM

More from the Next Earnings Dates Calendar

Earnings History:

Adamis Pharmaceuticals (ADMP): 11/22/2021 After close
RE/MAX Hldgs (RMAX): 11/22/2021 After close
Agilent Technologies (A): 11/22/2021 After close
Allied Esports (AESE): 11/22/2021 After close
Enanta Pharmaceuticals (ENTA): 11/22/2021 After close
LRAD (GNSS): 11/22/2021 After close
CVRx (CVRX): 11/22/2021 After close
Praxis Precision Medicine (PRAX): 11/22/2021 After close
Central Garden & Pet (CENT): 11/22/2021 After close
Central Garden & Pet (CENTA): 11/22/2021 After close

More from the Earnings History archive
Ship Finance Intl (SFL) is categorized under the Energy sector; to help you further research past earnings across stocks, below are some other companies in the same sector:

SLB Historical Earnings
SM Historical Earnings
SWN Historical Earnings
TALO Historical Earnings
TDW Historical Earnings
TELL Historical Earnings
TISI Historical Earnings
TK Historical Earnings
TNK Historical Earnings
TPL Historical Earnings
On this page we presented the SFL earnings and revenue history archive for Ship Finance Intl, comparing the historical top line revenue performance quarter by quarter, as well as the SFL earnings per share history. Any self directed investor doing their due diligence on SFL (or any other given stock) can benefit from researching all of the Ship Finance Intl past earnings and revenue results going backwards in time, and to help you with this Ship Finance Intl earnings history research, on this page we presented each quarter's resulting numbers in both table and graphical form for easy comparison. Studying these numbers can help an investor by providing important context with which to think about SFL's next earnings report. In your continued research on Ship Finance Intl we hope you will be sure to check out the further links included for earnings surprises as well as next earnings dates for SFL. Thanks for visiting, and the next time you need to research SFL earnings history (or the earnings history of another stock), we hope you'll think of our site as your go-to earnings history research resource of choice.
 

SFL Earnings History | www.NextEarningsDate.com | Copyright © 2020 - 2021, All Rights Reserved

Nothing in NextEarningsDate.com is intended to be investment advice, nor does it represent the opinion of, counsel from, or recommendations by BNK Invest Inc. or any of its affiliates, subsidiaries or partners. None of the information contained herein constitutes a recommendation that any particular security, portfolio, transaction, or investment strategy is suitable for any specific person. All viewers agree that under no circumstances will BNK Invest, Inc,. its subsidiaries, partners, officers, employees, affiliates, or agents be held liable for any loss or damage caused by your reliance on information obtained. By visiting, using or viewing this site, you agree to the following Full Disclaimer & Terms of Use and Privacy Policy. Video widget and market videos powered by Market News Video. Quote and option data delayed at least 15 minutes; stock quote data powered by Ticker Technologies, and Mergent.