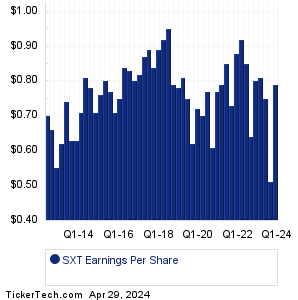
| Sensient Technologies Earnings History | ||||||||||||||||||||||||||||||||||||||||||||||||||||||||||||||||||||||||||||||||||||||||||||||||||||||||||||||||||||||||||||||||||||||||||||||||
|
|
|
| Sensient Technologies Earnings History | ||||||||||||||||||||||||||||||||||||||||||||||||||||||||||||||||||||||||||||||||||||||||||||||||||||||||||||||||||||||||||||||||||||||||||||||||
|
|
|
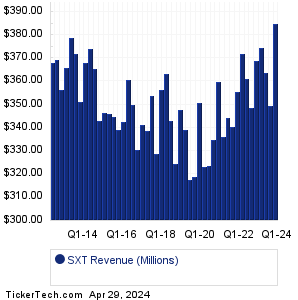
| SXT Revenue History | ||||||||||||||||||||||||||||||||||||||||||||||||||||||||||||||||||||||||||||||||||||||||||||||||||||||||||||||||||||||||||||||||||||||||||||||||
|
| SXT Current Stock Quote |
Get Dividend Alerts Get SEC Filing Alerts |
| SXT Stock Price Chart |
| Next Earnings Dates |
Next Earnings Date Calendar:GoHealth (GOCO): 3/14/2024 6:00 AMCentury Casinos (CNTY): 3/14/2024 6:00 AM Aveanna Healthcare Hldgs (AVAH): 3/14/2024 6:00 AM Nuvalent (NUVL): 3/14/2024 6:00 AM InfuSystems Holdings (INFU): 3/14/2024 6:30 AM Build-A-Bear Workshop (BBW): 3/14/2024 6:45 AM Solo Brands (DTC): 3/14/2024 6:50 AM Dollar Gen (DG): 3/14/2024 6:55 AM Dick's Sporting Goods (DKS): 3/14/2024 7:00 AM RumbleON (RMBL): 3/14/2024 7:00 AM More from the Next Earnings Dates Calendar Earnings History:VAALCO Energy (EGY): 3/13/2024 5:44 PMiSpecimen (ISPC): 3/13/2024 5:28 PM Rafael Holdings (RFL): 3/13/2024 5:04 PM OPAL Fuels (OPAL): 3/13/2024 5:00 PM Sphere 3D (ANY): 3/13/2024 5:00 PM Gold Resource (GORO): 3/13/2024 After close Artesian Resources (ARTNA): 3/13/2024 After close Profire Energy (PFIE): 3/13/2024 After close Lennar (LEN): 3/13/2024 After close Enzo Biochem (ENZ): 3/13/2024 After close More from the Earnings History archive |
| Featured Articles |
| Earnings Peers |
| Sensient Technologies (SXT) is categorized under the Materials sector; to help you further research past earnings across stocks, below are some other companies in the same sector:
SYNL Past Earnings TG Past Earnings TMST Past Earnings TOMZ Past Earnings TREX Past Earnings TROX Past Earnings TRS Past Earnings TUP Past Earnings TYDE Past Earnings UFPI Past Earnings |
Click the button below for your complimentary copy of Your Early Retirement Portfolio: Dividends Up to 9.5%—Every Month—Forever.
You'll discover the details on 4 stocks and funds that pay you massive dividends as high as 9.5%.