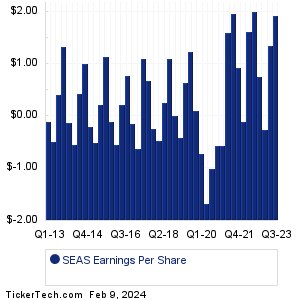
| SeaWorld Entertainment Earnings History | |||||||||||||||||||||||||||||||||||||||||||||||||||||||||||||||||||||||||||||||||||||||||||||||||||||||||||||||||||||||||||||||||||||||
|
|
|
| SeaWorld Entertainment Earnings History | |||||||||||||||||||||||||||||||||||||||||||||||||||||||||||||||||||||||||||||||||||||||||||||||||||||||||||||||||||||||||||||||||||||||
|
|
|
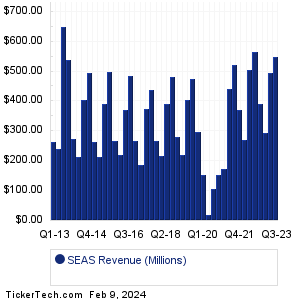
| SEAS Revenue History | |||||||||||||||||||||||||||||||||||||||||||||||||||||||||||||||||||||||||||||||||||||||||||||||||||||||||||||||||||||||||||||||||||||||
|
| SEAS Current Stock Quote |
Get Dividend Alerts Get SEC Filing Alerts |
| SEAS Stock Price Chart |
| Next Earnings Dates |
Next Earnings Date Calendar:PepsiCo (PEP): 2/9/2024 6:00 AMEmbecta (EMBC): 2/9/2024 6:00 AM Proto Labs (PRLB): 2/9/2024 6:00 AM Essent Group (ESNT): 2/9/2024 6:30 AM Catalent (CTLT): 2/9/2024 7:00 AM Blue Owl Cap (OWL): 2/9/2024 7:00 AM Mr. Cooper Gr (COOP): 2/9/2024 7:00 AM AMC Networks (AMCX): 2/9/2024 7:00 AM Newell Brands (NWL): 2/9/2024 7:00 AM W.P. Carey (WPC): 2/9/2024 7:30 AM More from the Next Earnings Dates Calendar Earnings History:Sensient Technologies (SXT): 2/8/2024 5:20 PMAptarGroup (ATR): 2/8/2024 5:00 PM Mettler-Toledo Intl (MTD): 2/8/2024 5:00 PM Centrus Energy (LEU): 2/8/2024 After close Victory Capital Holdings (VCTR): 2/8/2024 After close FirstEnergy (FE): 2/8/2024 After close COPT Defense (CDP): 2/8/2024 After close Pros Holdings (PRO): 2/8/2024 After close Impinj (PI): 2/8/2024 After close Mueller Water Products (MWA): 2/8/2024 After close More from the Earnings History archive |
| Featured Articles |
| Earnings Peers |
| SeaWorld Entertainment (SEAS) is categorized under the Services sector; to help you further research past earnings across stocks, below are some other companies in the same sector:
SFIX Past Earnings SFM Past Earnings SFT Past Earnings SG Past Earnings SGA Past Earnings SGMS Past Earnings SHAK Past Earnings SIC Past Earnings SIG Past Earnings SIRI Past Earnings |
Click the button below for your complimentary copy of Your Early Retirement Portfolio: Dividends Up to 9.5%—Every Month—Forever.
You'll discover the details on 4 stocks and funds that pay you massive dividends as high as 9.5%.