| Sculptor Cap Earnings History | ||||||||||||||||||||||||||||||||||||||||||||||||||||||||||||||||||||||||||||||||||||||||||||||||||||||||||||||||||||||||||||||||||||||||||

|
|
|
| Sculptor Cap Earnings History | ||||||||||||||||||||||||||||||||||||||||||||||||||||||||||||||||||||||||||||||||||||||||||||||||||||||||||||||||||||||||||||||||||||||||||
|
|
|
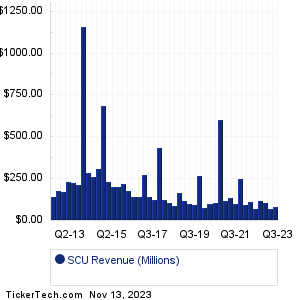
| SCU Revenue History | ||||||||||||||||||||||||||||||||||||||||||||||||||||||||||||||||||||||||||||||||||||||||||||||||||||||||||||||||||||||||||||||||||||||||||
|
| SCU Current Stock Quote |
Get Dividend Alerts Get SEC Filing Alerts |
| SCU Stock Price Chart |
| Next Earnings Dates |
Next Earnings Date Calendar:Circor Intl (CIR): 11/13/2023 6:00 AMHenry Schein (HSIC): 11/13/2023 6:30 AM Moleculin Biotech (MBRX): 11/13/2023 6:45 AM Fortrea Holdings (FTRE): 11/13/2023 7:00 AM N-able (NABL): 11/13/2023 7:00 AM Altus Power (AMPS): 11/13/2023 7:00 AM Acumen Pharmaceuticals (ABOS): 11/13/2023 7:00 AM Broadwind (BWEN): 11/13/2023 7:00 AM Akoustis Technologies (AKTS): 11/13/2023 7:00 AM Moving iMage Technologies (MITQ): 11/13/2023 7:00 AM More from the Next Earnings Dates Calendar Earnings History:Fiserv (FI): 11/12/2023 12:48 PMKentucky First Federal (KFFB): 11/10/2023 3:18 PM BTCS (BTCS): 11/10/2023 9:15 AM Sunworks (SUNW): 11/10/2023 9:00 AM Inuvo (INUV): 11/10/2023 8:30 AM The Real Good Food (RGF): 11/10/2023 8:00 AM 374Water (SCWO): 11/10/2023 8:00 AM Longeveron (LGVN): 11/10/2023 7:30 AM Golden Minerals (AUMN): 11/10/2023 6:45 AM Turnstone Biologics (TSBX): 11/9/2023 9:49 PM More from the Earnings History archive |
| Featured Articles |
| Earnings Peers |
| Sculptor Cap (SCU) is categorized under the Financials sector; to help you further research past earnings across stocks, below are some other companies in the same sector:
SEIC Past Earnings SELF Past Earnings SEVN Past Earnings SF Past Earnings SFBC Past Earnings SFBS Past Earnings SFE Past Earnings SFNC Past Earnings SFST Past Earnings SHBI Past Earnings |
Recommended: PODD Technical Analysis, NPO Price Target, EGO shares outstanding history.
Click the button below for your complimentary copy of Your Early Retirement Portfolio: Dividends Up to 9.5%—Every Month—Forever.
You'll discover the details on 4 stocks and funds that pay you massive dividends as high as 9.5%.