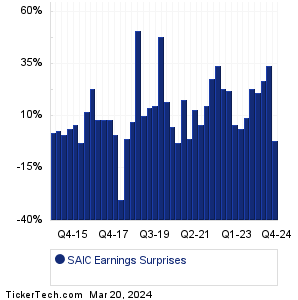
| Science Applications Intl Earnings Surprises | ||||||||||||||||||||||||||||||||||||||||||||||||||||||||||||||||||||||||||||||||||||||||||||||||||||||||||||||||||||||||||||||||||||||||||||||||||||||||||||||||||||
|
|
|
| Science Applications Intl Earnings Surprises | ||||||||||||||||||||||||||||||||||||||||||||||||||||||||||||||||||||||||||||||||||||||||||||||||||||||||||||||||||||||||||||||||||||||||||||||||||||||||||||||||||||
|
|
|
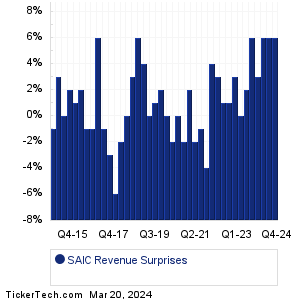
| SAIC Revenue Surprises | ||||||||||||||||||||||||||||||||||||||||||||||||||||||||||||||||||||||||||||||||||||||||||||||||||||||||||||||||||||||||||||||||||||||||||||||||||||||||||||||||||||
|
| SAIC Current Stock Quote |
Get Dividend Alerts Get SEC Filing Alerts |
| SAIC Stock Price Chart |
| Next Earnings Dates |
Next Earnings Date Calendar:J.Jill (JILL): 3/20/2024 6:45 AMGeneral Mills (GIS): 3/20/2024 7:00 AM Signet Jewelers (SIG): 3/20/2024 7:00 AM Travelzoo (TZOO): 3/20/2024 7:00 AM Ollie's Bargain Outlet (OLLI): 3/20/2024 7:30 AM Bakkt Hldgs (BKKT): 3/20/2024 7:30 AM Astria Therapeutics (ATXS): 3/20/2024 8:00 AM Lifeway Foods (LWAY): 3/20/2024 9:00 AM Rani Therapeutics Hldgs (RANI): 3/20/2024 After close Sera Prognostics (SERA): 3/20/2024 After close More from the Next Earnings Dates Calendar Earnings History:Harrow Health (HROW): 3/19/2024 5:26 PMImmunityBio (IBRX): 3/19/2024 After close Westwater Resources (WWR): 3/19/2024 After close Relmada Therapeutics (RLMD): 3/19/2024 After close DiaMedica Therapeutics (DMAC): 3/19/2024 After close Adicet Bio (ACET): 3/19/2024 After close Mitek Systems (MITK): 3/19/2024 After close Precigen (PGEN): 3/19/2024 After close Tyra Biosciences (TYRA): 3/19/2024 After close TeraWulf (WULF): 3/19/2024 After close More from the Earnings History archive |
| Earnings Peers |
| Science Applications Intl (SAIC) is categorized under the Technology sector; to help you further research past earnings across stocks, below are some other companies in the same sector:
SAIL Historical Earnings SASI Historical Earnings SATS Historical Earnings SBAC Historical Earnings SCKT Historical Earnings SCOR Historical Earnings SCSC Historical Earnings SCWX Historical Earnings SDIG Historical Earnings SEAC Historical Earnings |
Click the button below for your complimentary copy of Your Early Retirement Portfolio: Dividends Up to 9.5%—Every Month—Forever.
You'll discover the details on 4 stocks and funds that pay you massive dividends as high as 9.5%.