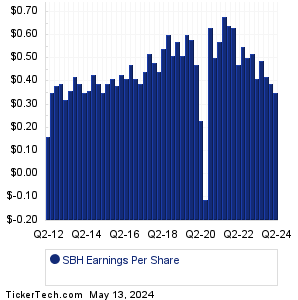
| SBH Earnings History | ||||||||||||||||||||||||||||||||||||||||||||||||||||||||||||||||||||||||||||||||||||||||||||||||||||||||||||||||||||||||||||||||||||||||||||||||||||||
|
|
|
| SBH Earnings History | ||||||||||||||||||||||||||||||||||||||||||||||||||||||||||||||||||||||||||||||||||||||||||||||||||||||||||||||||||||||||||||||||||||||||||||||||||||||
|
|
|
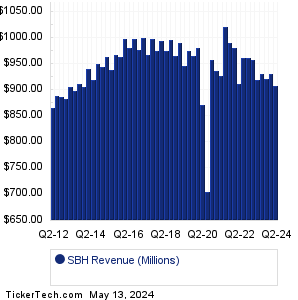
| SBH Revenue History | ||||||||||||||||||||||||||||||||||||||||||||||||||||||||||||||||||||||||||||||||||||||||||||||||||||||||||||||||||||||||||||||||||||||||||||||||||||||
|
| SBH Current Stock Quote |
Get Dividend Alerts Get SEC Filing Alerts |
| SBH Stock Price Chart |
| Next Earnings Dates |
Next Earnings Date Calendar:Dollar Tree (DLTR): 3/13/2024 6:30 AMLiquidia (LQDA): 3/13/2024 6:30 AM Target Hospitality (TH): 3/13/2024 6:45 AM Sharecare (SHCR): 3/13/2024 7:00 AM Petco Health and Wellness (WOOF): 3/13/2024 7:00 AM WideOpenWest (WOW): 3/13/2024 7:00 AM iSpecimen (ISPC): 3/13/2024 7:30 AM Aadi Bioscience (AADI): 3/13/2024 8:00 AM Optical Cable (OCC): 3/13/2024 8:00 AM Vera Bradley (VRA): 3/13/2024 8:00 AM More from the Next Earnings Dates Calendar Earnings History:Riot Platforms (RIOT): 3/12/2024 5:00 PMAnixa Biosciences (ANIX): 3/12/2024 5:00 PM Eastern Co (EML): 3/12/2024 After close PHX Minerals (PHX): 3/12/2024 After close Oportun Financial (OPRT): 3/12/2024 After close Allbirds (BIRD): 3/12/2024 After close BRT Apartments (BRT): 3/12/2024 After close Vintage Wine Estates (VWE): 3/12/2024 After close Aterian (ATER): 3/12/2024 After close Doma Holdings (DOMA): 3/12/2024 After close More from the Earnings History archive |
| Featured Articles |
| Earnings Peers |
| Sally Beauty Holdings (SBH) is categorized under the Services sector; to help you further research past earnings across stocks, below are some other companies in the same sector:
SBUX Past Earnings SCHL Past Earnings SCI Past Earnings SCPL Past Earnings SCVL Past Earnings SDOT Past Earnings SEAS Past Earnings SFIX Past Earnings SFM Past Earnings SFT Past Earnings |
Click the button below for your complimentary copy of Your Early Retirement Portfolio: Dividends Up to 9.5%—Every Month—Forever.
You'll discover the details on 4 stocks and funds that pay you massive dividends as high as 9.5%.