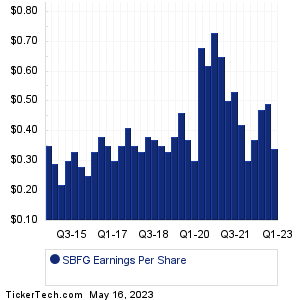
| SB Finl Gr Earnings History | ||||||||||||||||||||||||||||||||||||||||||||||||||||||||||||||||||||||||||||||||||||||||||||||||||||||||||||
|
|
|
| SB Finl Gr Earnings History | ||||||||||||||||||||||||||||||||||||||||||||||||||||||||||||||||||||||||||||||||||||||||||||||||||||||||||||
|
|
|
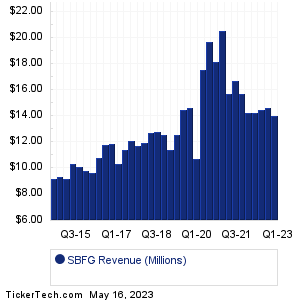
| SBFG Revenue History | ||||||||||||||||||||||||||||||||||||||||||||||||||||||||||||||||||||||||||||||||||||||||||||||||||||||||||||
|
| SBFG Current Stock Quote |
Get Dividend Alerts Get SEC Filing Alerts |
| SBFG Stock Price Chart |
| Next Earnings Dates |
Next Earnings Date Calendar:Home Depot (HD): 5/16/2023 6:00 AMNRX Pharmaceuticals (NRXP): 5/16/2023 6:50 AM Baker Hughes (BKR): 5/16/2023 7:00 AM Provention Bio (PRVB): 5/16/2023 7:00 AM Bioventus (BVS): 5/16/2023 7:30 AM Palatin Techs (PTN): 5/16/2023 7:30 AM Sypris Solutions (SYPR): 5/16/2023 7:45 AM Digital Ally (DGLY): 5/16/2023 8:00 AM Copart (CPRT): 5/16/2023 After close Doximity (DOCS): 5/16/2023 After close More from the Next Earnings Dates Calendar Earnings History:Perspective Therapeutics (CATX): 5/15/2023 8:22 PMSmith-Midland (SMID): 5/15/2023 6:05 PM Empire Petroleum (EP): 5/15/2023 5:56 PM Canoo (GOEV): 5/15/2023 5:35 PM Tattooed Chef (TTCF): 5/15/2023 5:33 PM Nutex Health (NUTX): 5/15/2023 5:30 PM Presidio Property Trust (SQFT): 5/15/2023 5:15 PM Predictive Oncology (POAI): 5/15/2023 5:15 PM Acer Therapeutics (ACER): 5/15/2023 5:10 PM NextPlat (NXPL): 5/15/2023 5:00 PM More from the Earnings History archive |
| Featured Articles |
| Earnings Peers |
| SB Finl Gr (SBFG) is categorized under the Financials sector; to help you further research past earnings across stocks, below are some other companies in the same sector:
SBRA Past Earnings SBSI Past Earnings SBT Past Earnings SC Past Earnings SCHW Past Earnings SCU Past Earnings SEIC Past Earnings SELF Past Earnings SEVN Past Earnings SF Past Earnings |
Click the button below for your complimentary copy of Your Early Retirement Portfolio: Dividends Up to 7.8%—Every Month—Forever.
You'll discover the details on 4 stocks and funds that pay you massive dividends as high as 7.8%.