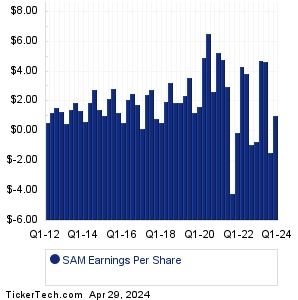
| SAM Earnings History | |||||||||||||||||||||||||||||||||||||||||||||||||||||||||||||||||||||||||||||||||||||||||||||||||||||||||||||||||||||||||||||||||||||||||||||||||||
|
|
|
| SAM Earnings History | |||||||||||||||||||||||||||||||||||||||||||||||||||||||||||||||||||||||||||||||||||||||||||||||||||||||||||||||||||||||||||||||||||||||||||||||||||
|
|
|
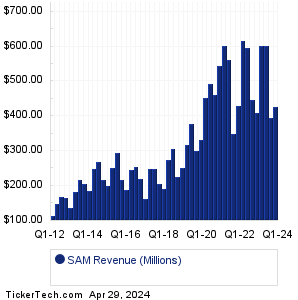
| SAM Revenue History | |||||||||||||||||||||||||||||||||||||||||||||||||||||||||||||||||||||||||||||||||||||||||||||||||||||||||||||||||||||||||||||||||||||||||||||||||||
|
| SAM Current Stock Quote |
Get Dividend Alerts Get SEC Filing Alerts |
| SAM Stock Price Chart |
| Next Earnings Dates |
Next Earnings Date Calendar:Vertiv Hldgs (VRT): 4/24/2024 5:00 AMLithia Motors (LAD): 4/24/2024 5:00 AM Central Pacific Financial (CPF): 4/24/2024 5:30 AM Thermo Fisher Scientific (TMO): 4/24/2024 6:00 AM Hilton Worldwide Holdings (HLT): 4/24/2024 6:00 AM TE Connectivity (TEL): 4/24/2024 6:00 AM Synchrony Finl (SYF): 4/24/2024 6:00 AM Bunge (BG): 4/24/2024 6:00 AM Owens-Corning (OC): 4/24/2024 6:00 AM Pacific Premier Bancorp (PPBI): 4/24/2024 6:00 AM More from the Next Earnings Dates Calendar Earnings History:Rush Enterprises (RUSHA): 4/23/2024 6:01 PMRush Enterprises (RUSHB): 4/23/2024 6:01 PM Molecular Templates (MTEM): 4/23/2024 6:00 PM Flushing Financial (FFIC): 4/23/2024 5:29 PM First Busey (BUSE): 4/23/2024 5:00 PM Encore Wire (WIRE): 4/23/2024 5:00 PM Baker Hughes (BKR): 4/23/2024 5:00 PM Enterprise Bancorp (EBTC): 4/23/2024 After close Range Resources (RRC): 4/23/2024 After close Veritex Holdings (VBTX): 4/23/2024 After close More from the Earnings History archive |
| Featured Articles |
| Earnings Peers |
| Boston Beer Co (SAM) is categorized under the Consumer sector; to help you further research past earnings across stocks, below are some other companies in the same sector:
SANW Past Earnings SGC Past Earnings SHOO Past Earnings SHYF Past Earnings SJM Past Earnings SKX Past Earnings SMP Past Earnings SMPL Past Earnings SNAX Past Earnings SNPO Past Earnings |
Recommended: SPCM market cap history, OPY YTD Return, COF Average Annual Return.
Click the button below for your complimentary copy of Your Early Retirement Portfolio: Dividends Up to 8.7%—Every Month—Forever.
You'll discover the details on 4 stocks and funds that pay you massive dividends as high as 8.7%.