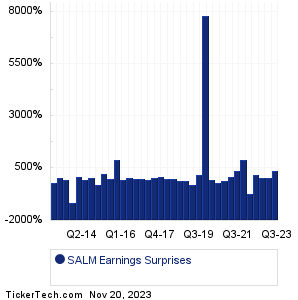
| SALM Earnings Surprises | ||||||||||||||||||||||||||||||||||||||||||||||||||||||||||||||||||||||||||||||||||||||||||||||||||||||||||||||||||||||||||||||||||||||||||||||||||||
|
|
|
| SALM Earnings Surprises | ||||||||||||||||||||||||||||||||||||||||||||||||||||||||||||||||||||||||||||||||||||||||||||||||||||||||||||||||||||||||||||||||||||||||||||||||||||
|
|
|
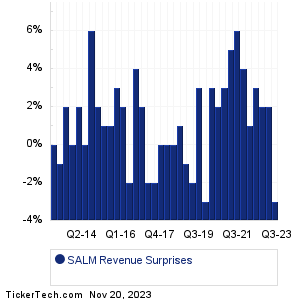
| SALM Revenue Surprises | ||||||||||||||||||||||||||||||||||||||||||||||||||||||||||||||||||||||||||||||||||||||||||||||||||||||||||||||||||||||||||||||||||||||||||||||||||||
|
| SALM Current Stock Quote |
Get Dividend Alerts Get SEC Filing Alerts |
| SALM Stock Price Chart |
| Next Earnings Dates |
Next Earnings Date Calendar:Vitesse Energy (VTS): 11/20/2023 1:18 AMGE HealthCare Techs (GEHC): 11/20/2023 2:01 AM Techprecision (TPCS): 11/20/2023 After close Central Garden & Pet (CENTA): 11/20/2023 After close Enanta Pharma (ENTA): 11/20/2023 After close Remark Hldgs (MARK): 11/20/2023 After close Central Garden & Pet (CENT): 11/20/2023 After close Agilent Technologies (A): 11/20/2023 After close Keysight Techs (KEYS): 11/20/2023 After close Zoom Video Comms (ZM): 11/20/2023 After close More from the Next Earnings Dates Calendar Earnings History:Leonardo DRS (DRS): 11/18/2023 After closePrimeEnergy Resources (PNRG): 11/17/2023 After close Twist Bioscience (TWST): 11/17/2023 7:30 AM Destination XL Group (DXLG): 11/17/2023 7:00 AM Buckle (BKE): 11/17/2023 6:50 AM BJ's Wholesale Club (BJ): 11/17/2023 6:45 AM Spectrum Brands Holdings (SPB): 11/17/2023 6:30 AM Atkore (ATKR): 11/17/2023 6:00 AM UGI (UGI): 11/16/2023 5:20 PM Astra Space (ASTR): 11/16/2023 5:05 PM More from the Earnings History archive |
| Earnings Peers |
| Salem Media Group (SALM) is categorized under the Services sector; to help you further research past earnings across stocks, below are some other companies in the same sector:
SBGI Historical Earnings SBH Historical Earnings SBUX Historical Earnings SCHL Historical Earnings SCI Historical Earnings SCPL Historical Earnings SCVL Historical Earnings SDOT Historical Earnings SEAS Historical Earnings SFIX Historical Earnings |
Recommended: FINX market cap history, WPCB shares outstanding history, Funds Holding USDU.
Click the button below for your complimentary copy of Your Early Retirement Portfolio: Dividends Up to 9.5%—Every Month—Forever.
You'll discover the details on 4 stocks and funds that pay you massive dividends as high as 9.5%.